Answer to Question 1
Graph A: Multiple Baseline across Students
Visual Analysis of Graph: A functional relation is established as the change in the dependent variable is established after implementation of the independent variable and replicated across tiers. All three tiers demonstrate an ascending trend with an immediacy effect.
Graph B: AB Design
Visual Analysis of Graph: Graph B does not establish experimental control as a functional relation is not established. There is an ascending trend indicating that the intervention is effective, but there is no control for confounding variables and no replication.
Answer to Question 2
Calculating percentage of overlapping data points:
1) Determine range of data point values for first condition
2) Count number of data points plotted in second condition
3) Count number of data points of second condition that fall within range of values of first condition.
4) Divide the number of data points that fall within range of first condition by total number of data points of second condition and multiply by 100.

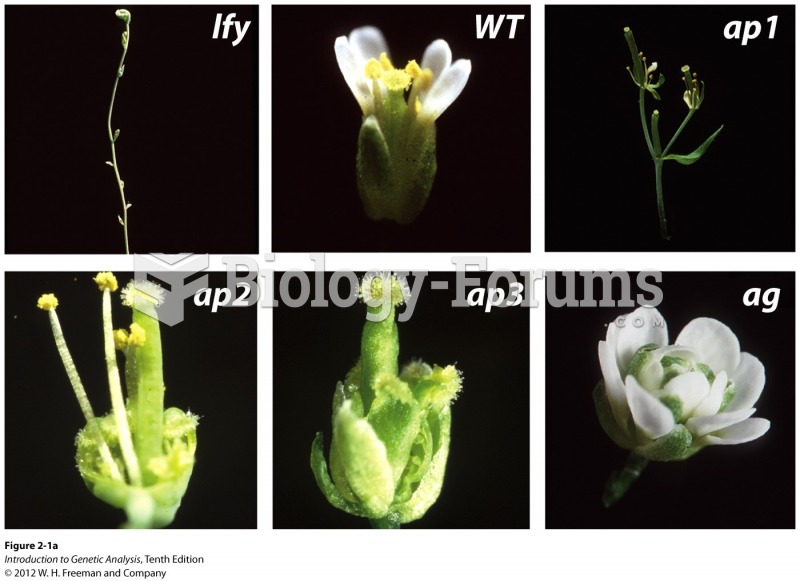 Genetic analysis begins with mutants
 Endotracheal intubation. First, a lighted scope is used to identify the trachea from the esophagus.
 Electroencephalography (EEG). To perform the EEG, electrodes attached to the patient’s head pick up
 Using alert labels enables the medical staff to quickly identify important information such as ...
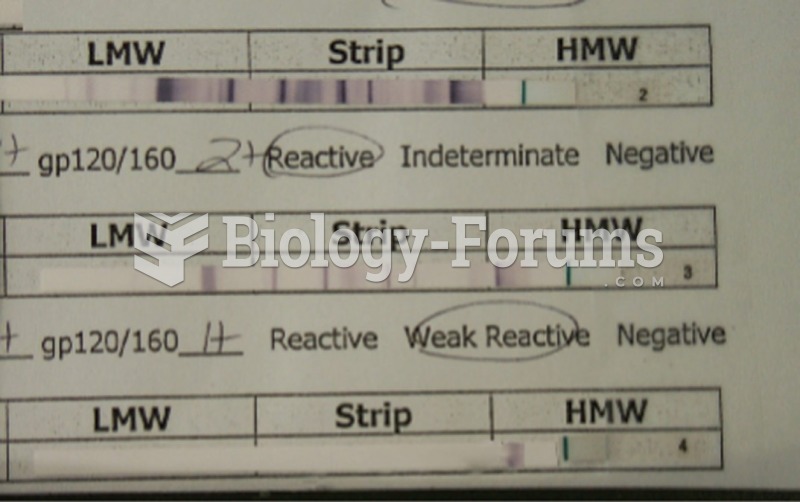 Western blot analysis of viral antigens. The nitrocellulose strips from the kit contain blotted ...
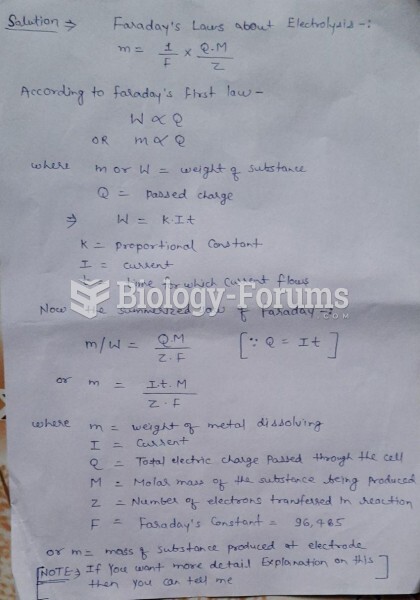 Identify the variable representing each described quantity in the equation