Answer to Question 1
Graph A: Multiple Baseline across Students
Visual Analysis of Graph: A functional relation is established as the change in the dependent variable is established after implementation of the independent variable and replicated across tiers. All three tiers demonstrate an ascending trend with an immediacy effect.
Graph B: AB Design
Visual Analysis of Graph: Graph B does not establish experimental control as a functional relation is not established. There is an ascending trend indicating that the intervention is effective, but there is no control for confounding variables and no replication.
Answer to Question 2
Calculating percentage of overlapping data points:
1) Determine range of data point values for first condition
2) Count number of data points plotted in second condition
3) Count number of data points of second condition that fall within range of values of first condition.
4) Divide the number of data points that fall within range of first condition by total number of data points of second condition and multiply by 100.

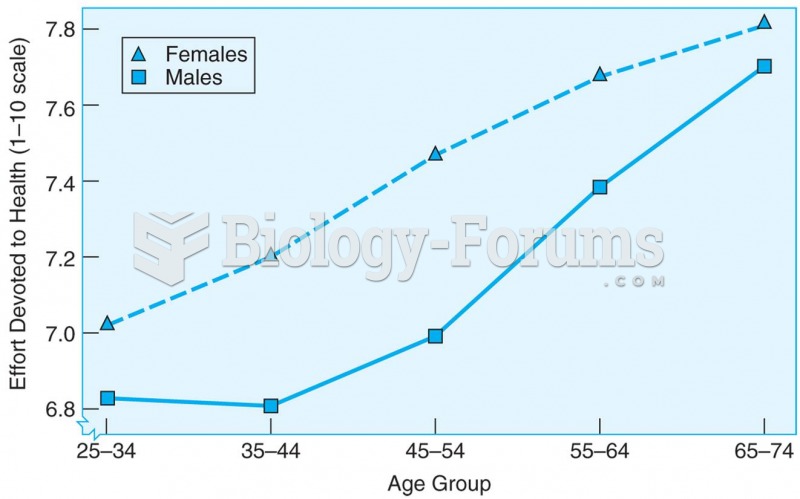 Cross-sectional data showing that the amount of effort spent on personal health care increases with
 VITROS DT60II automated blood analysis system.
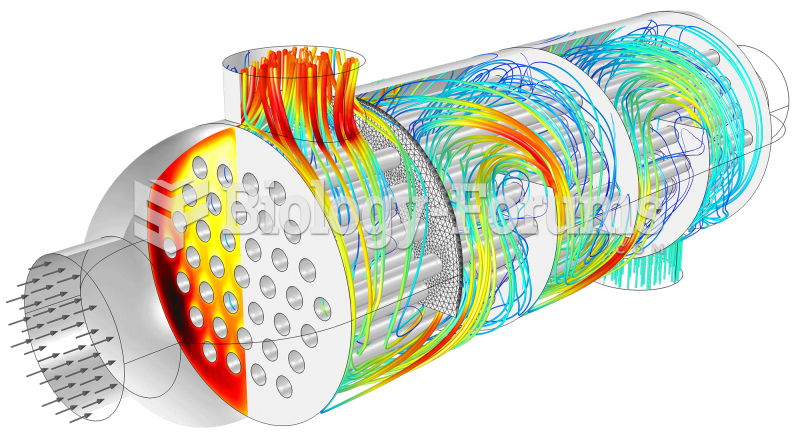 Shell-Tube CHE 413 Chemical Engineering Equipment Design
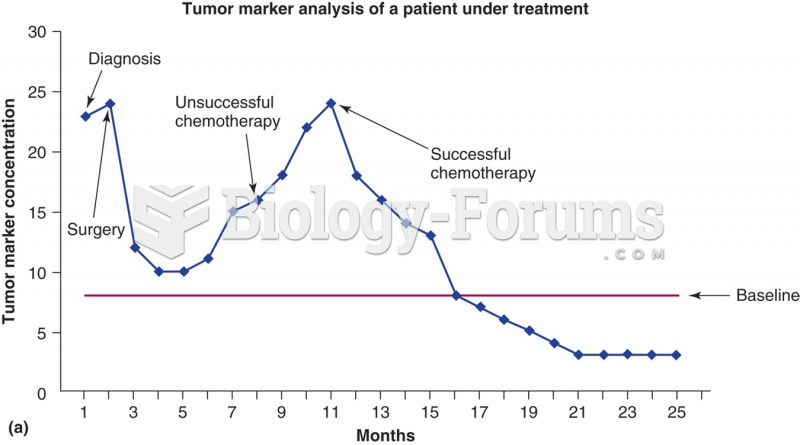 Tumor marker analysis of a patient undergoing therapy, who (1) after surgery had residual disease ...
 Visual Elements of Pictorial Expression: A. Carpet Page from the Lindisfarne Gospels
 Northern blot analysis of dfmr1 gene expression in Drosophila ovaries and embryos