|
|
|

 Symbolic language may have helped reinforce exclusive sexual relationships within social groups in l
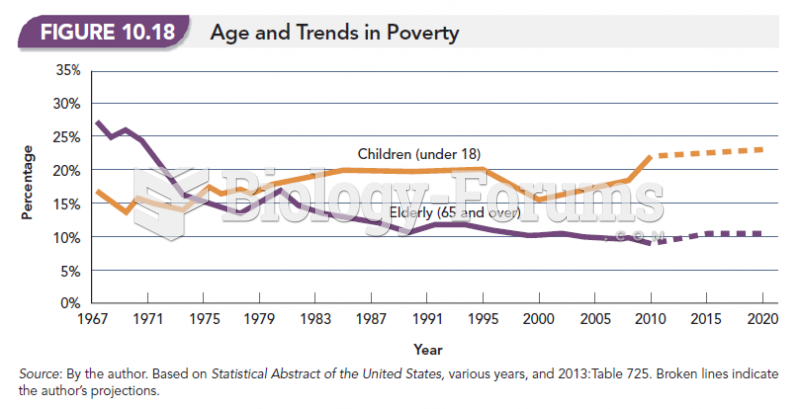 Age and Trends in Poverty
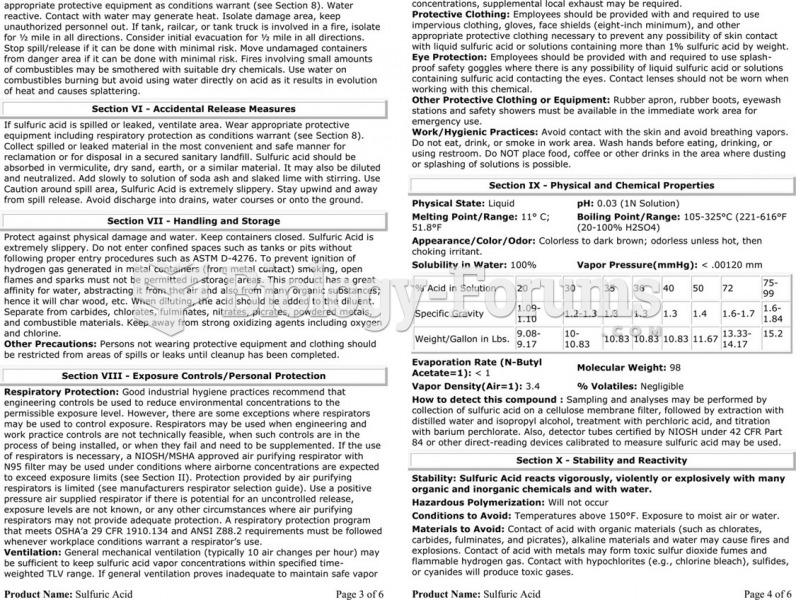 The material safety data sheet (MSDS) for sulfuric acid showing the detailed technical information ...
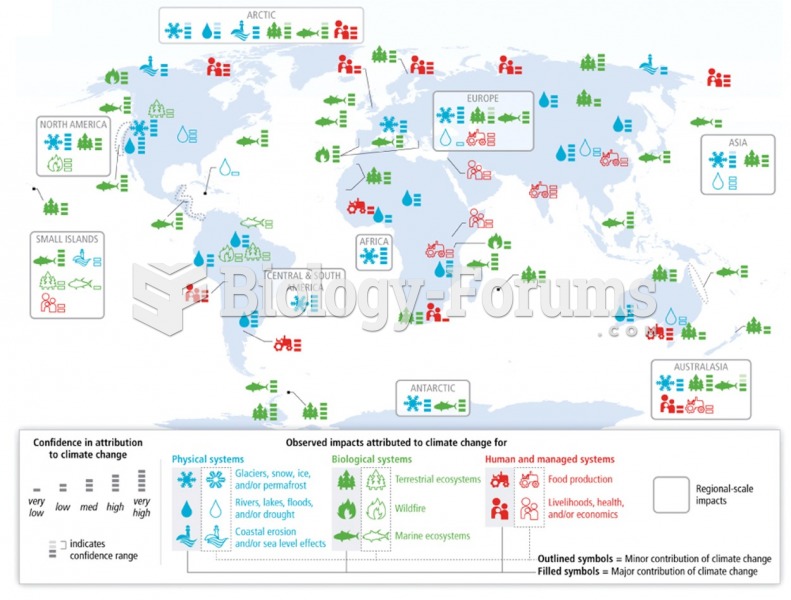 Current and future trends and impacts (IPCC)
 Demographic Data for Nigeria
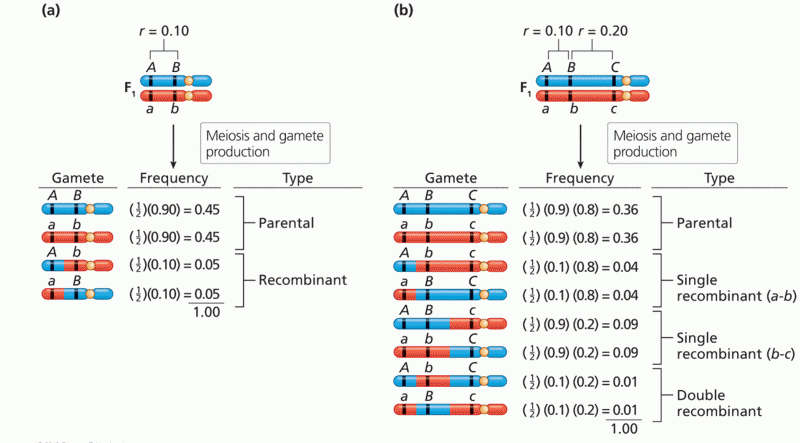 Gamete genotype frequencies calculated from genetic linkage data