|
|
|

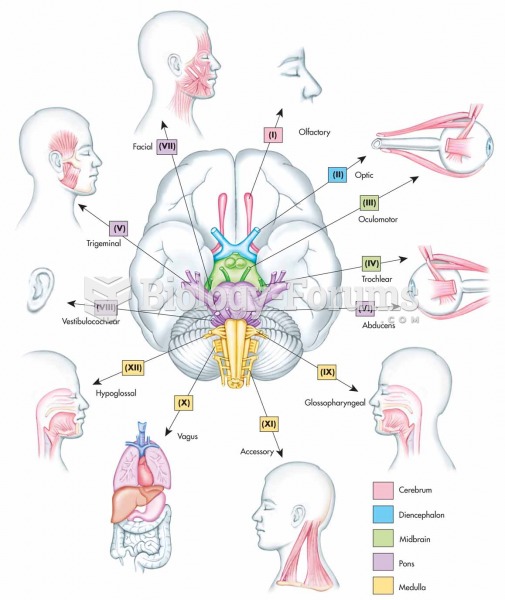 Relationship of the 12 cranial nerves to specific regions of the brain.
 Dose–response relationship
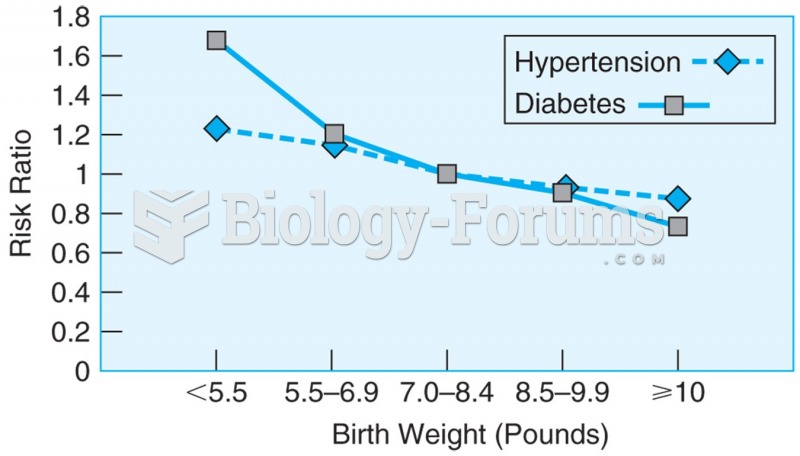 Data from more than 22,000 men over the age of 40, showing the relationship between birth weight and ...
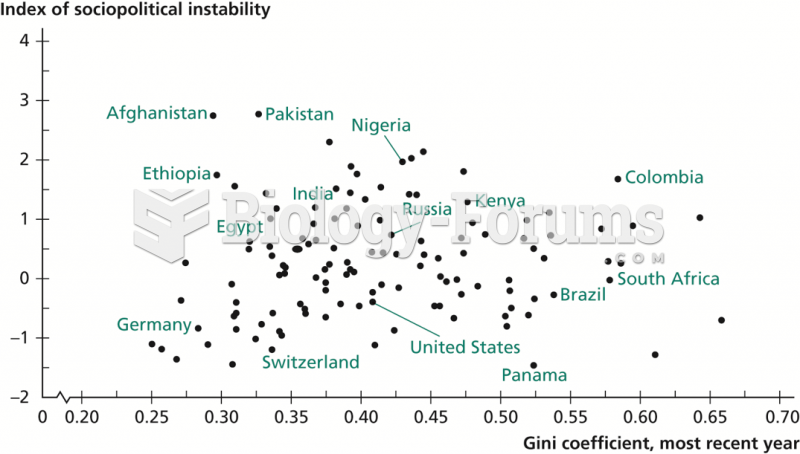 Relationship between Income Inequality and Sociopolitical Instability
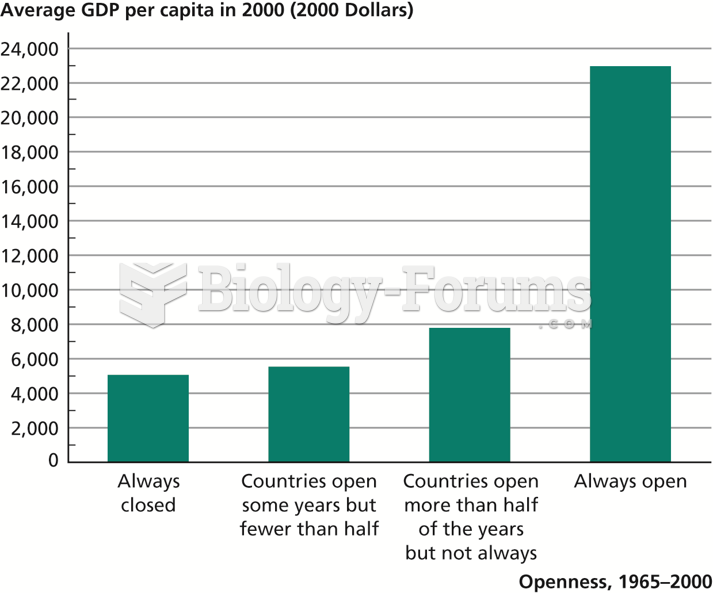 Relationship between Economic Openness and GDP per Capita
 Most elderly enjoy maintaining relationship with their grandkids