This topic contains a solution. Click here to go to the answer
|
|
|

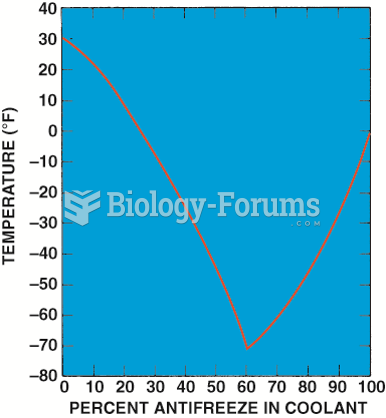 Graph showing the relationship between the freezing point of the coolant and the percentage of ...
 Velocity-time Graph
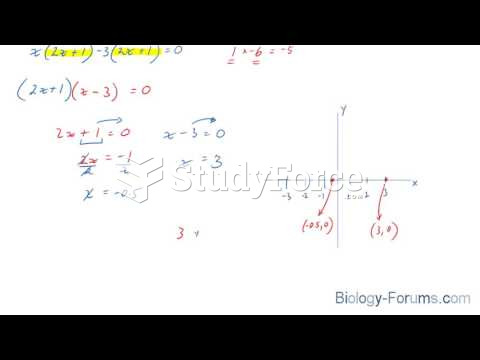 How to manually solve and graph any quadratic equation
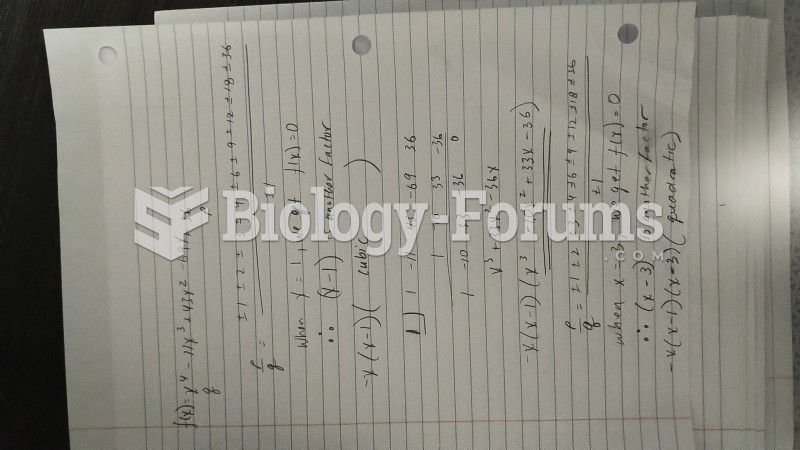 Graph the function by hand & label key points on graph:
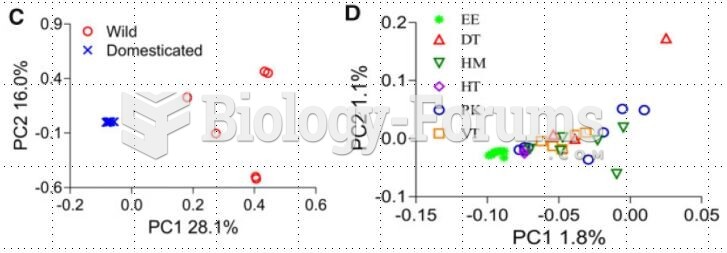 How to interpret these PCA Graph?
 graph
graph