This topic contains a solution. Click here to go to the answer
|
|
|

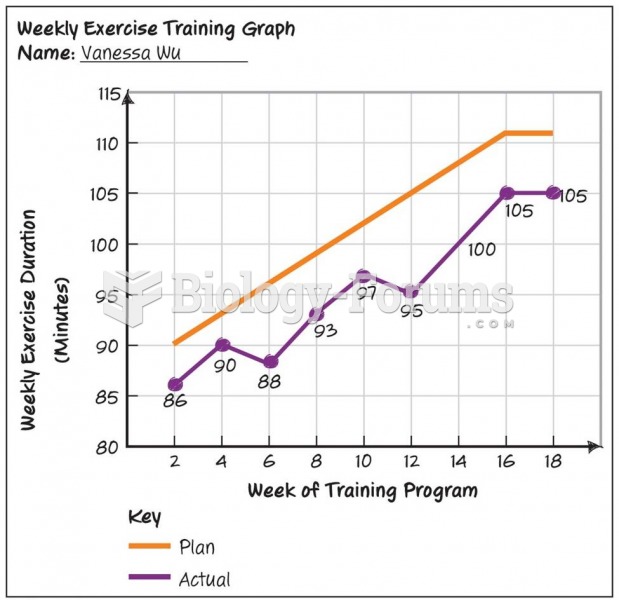 Progression Graph: Fitness Plan
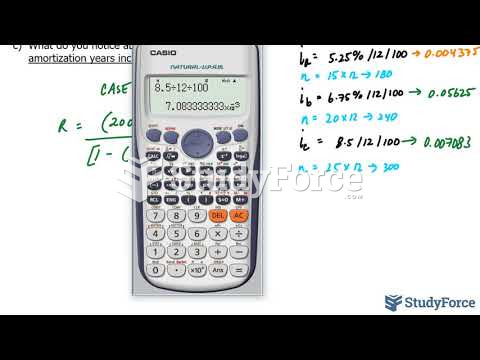 How to calculate monthly payments at varying amortization periods (Question 3)
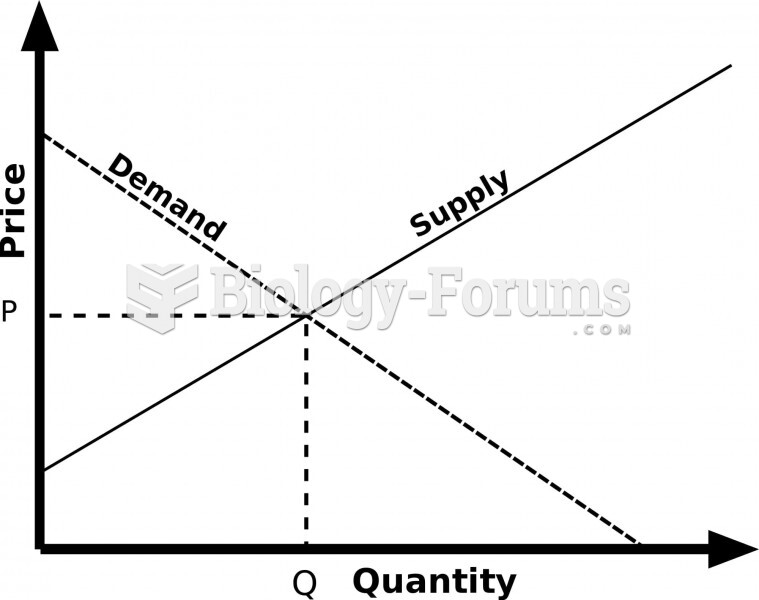 The original Supply and Demand graph
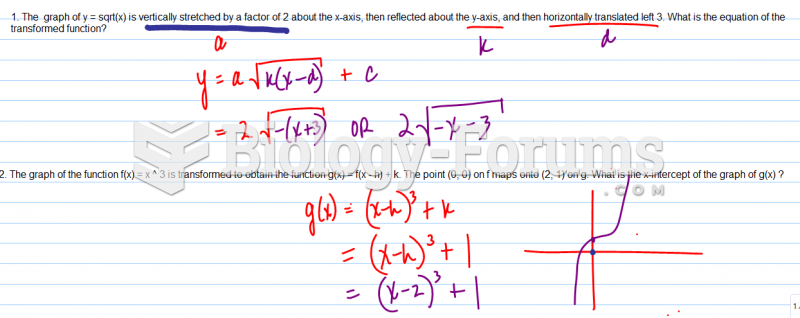 The graph of y = sqrt(x) is vertically stretched by a factor
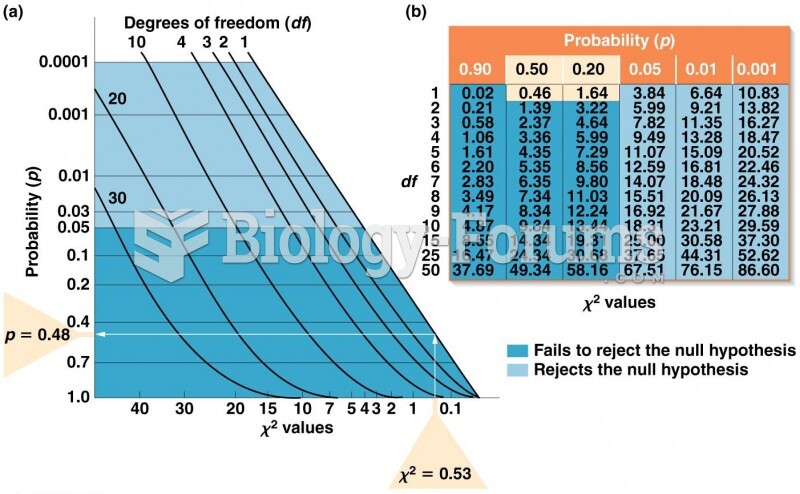 (a) Graph for converting values to p values. (b) Table of values for selected values of df
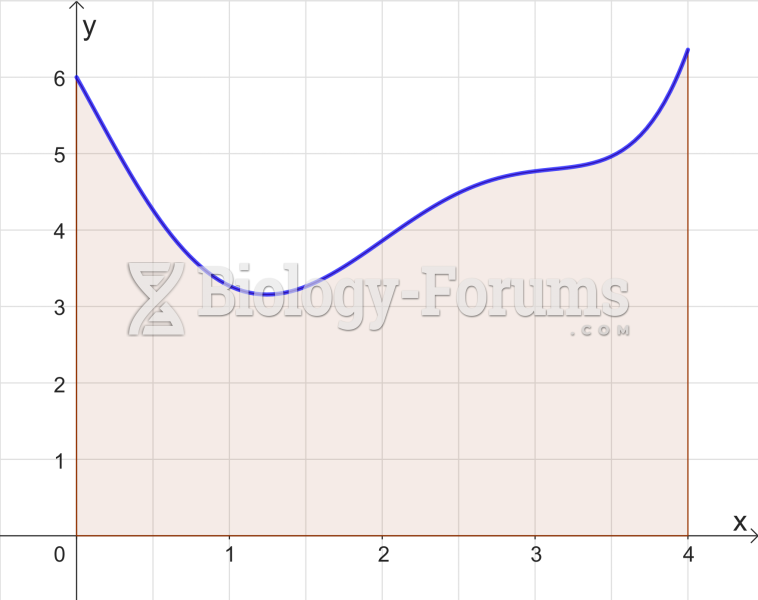 Trapezoidal Rule Graph