This topic contains a solution. Click here to go to the answer
|
|
|

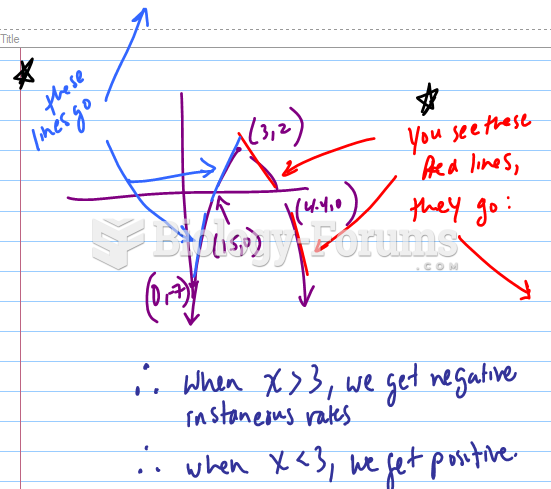 If a graph has the following x-intercepts, which value of x is the instantaneous rate of change ...
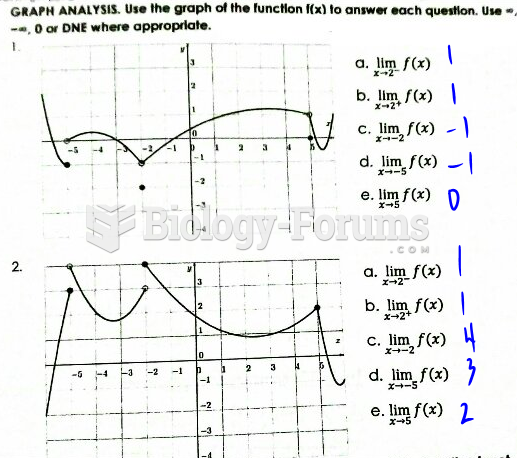 Use the graph of the function f(x) to answer each question.
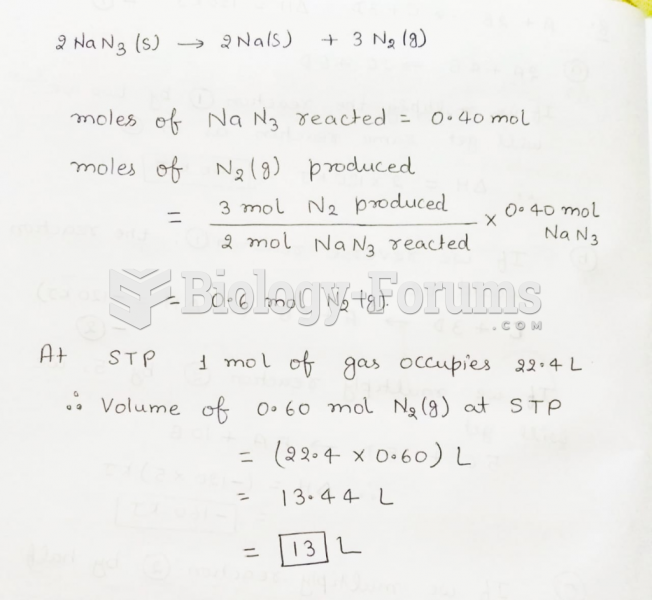 If 0.40 mol of NaN3 reacts completely in the reaction shown below, then ________ L of N2 will ...
 Finding the graph of a Parabola using certain values
 Finding the graph of a Parabola using certain values
 Graph Liters per Hour