This topic contains a solution. Click here to go to the answer
|
|
|

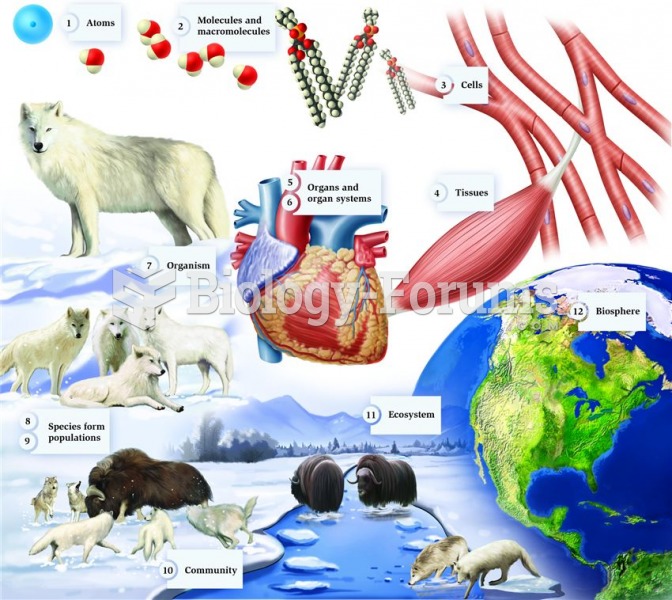 The levels of biological organization
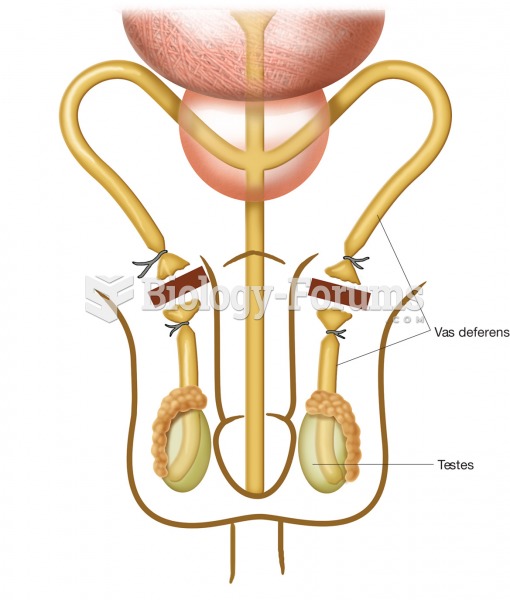 A vasectomy, showing how each vas deferens is tied off in two places and then a section is removed f
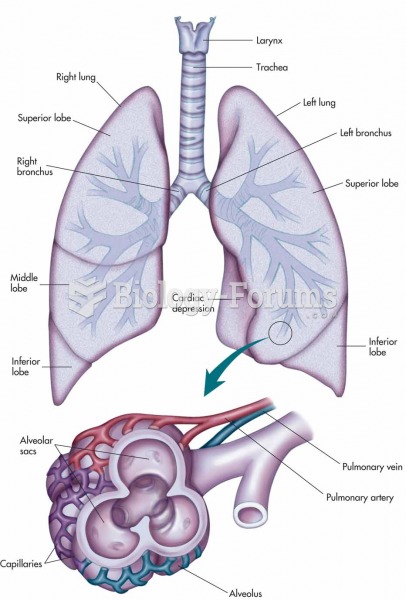 Larynx, trachea, bronchi, and lungs with an expanded view showing the structures of an alveolus and
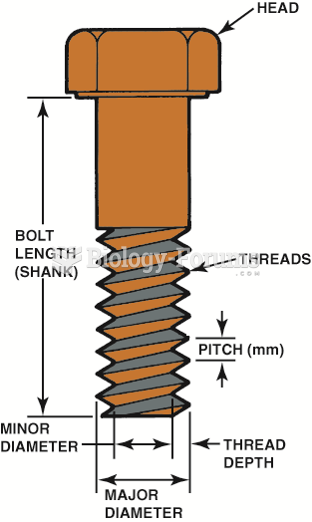 The dimensions of a typical bolt showing where sizes are measured.
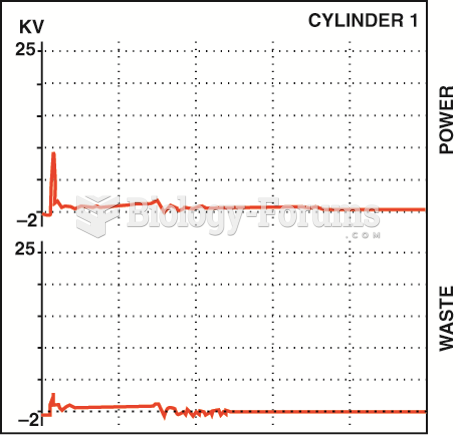 A dual-trace scope pattern showing both the power and the waste spark from the same coil ...
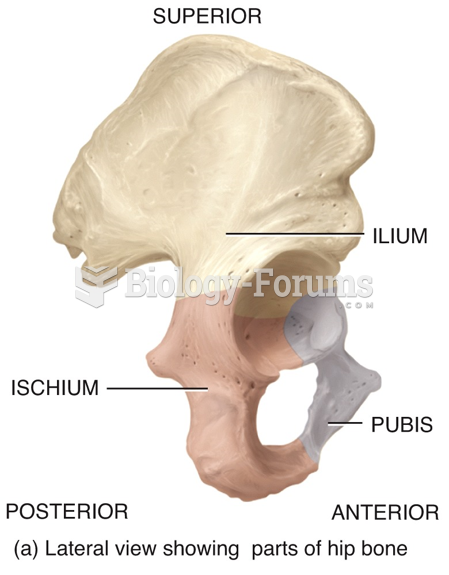 Lateral view showing pans of hip bone