This topic contains a solution. Click here to go to the answer
|
|
|

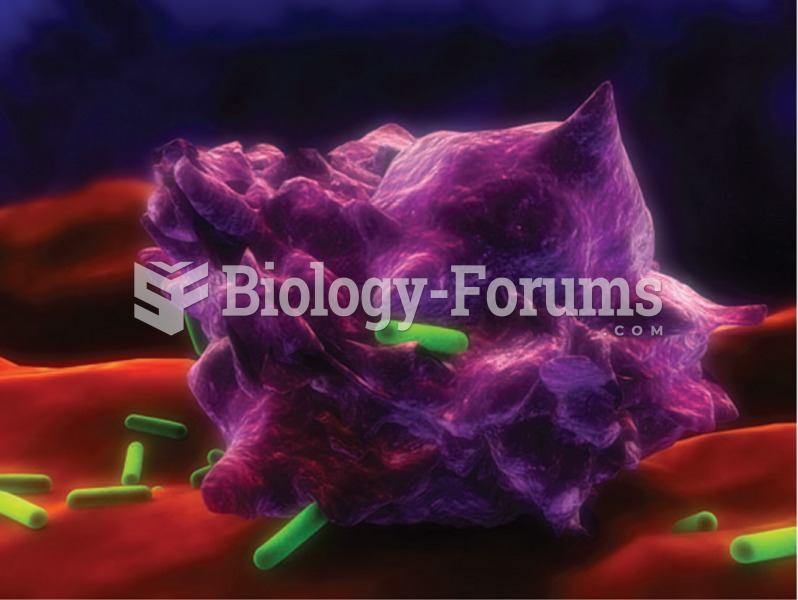 Enhanced photomicrograph showing a macrophage (purple) attack- ing bacillus Escherichia coli (green)
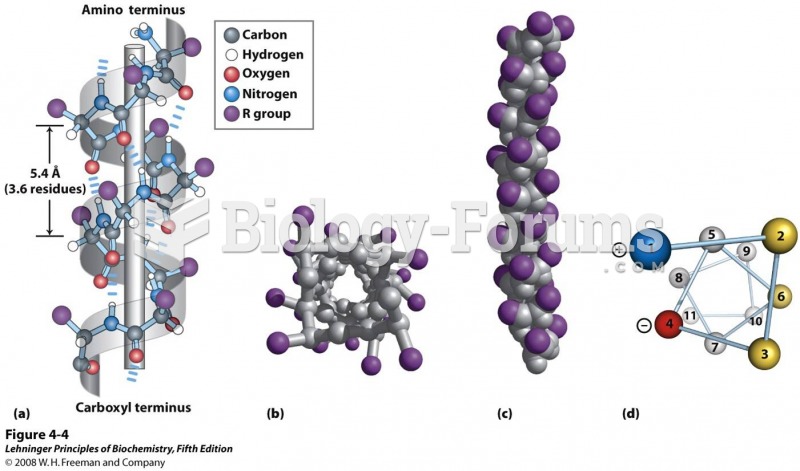 Models of the α helix, showing different aspects of its structure
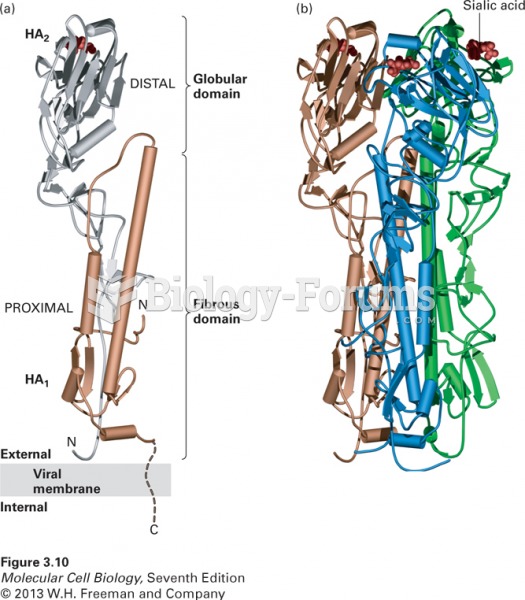 Tertiary and quaternary levels of structure
 How to use right endpoints to find an expression showing the area of a function
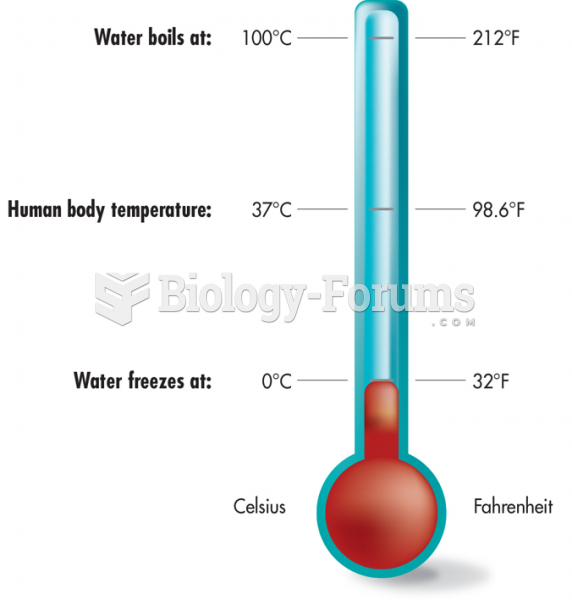 Thermometer Showing the Temperatures
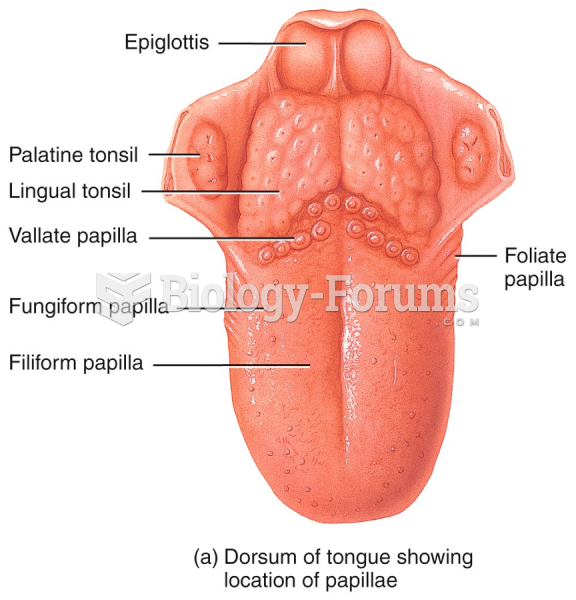 Dorsum of tongue showing location of papillae