This topic contains a solution. Click here to go to the answer
|
|
|

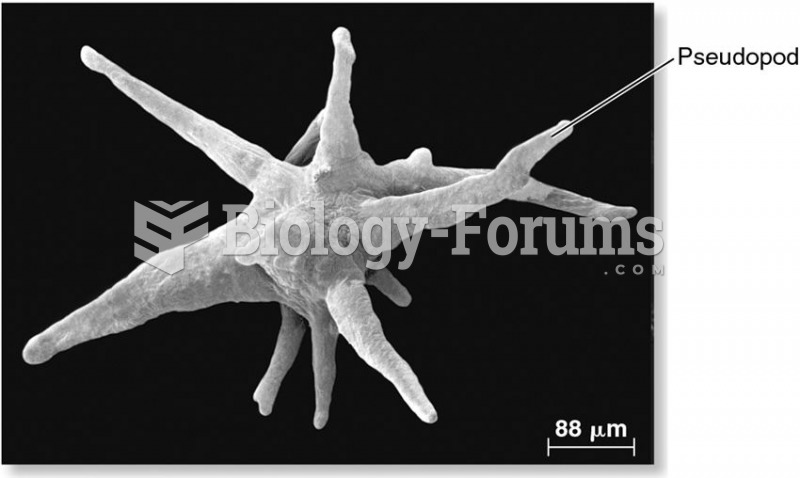 A member of the amoebozoan genus Pelomyxa, showing pseudopodia.
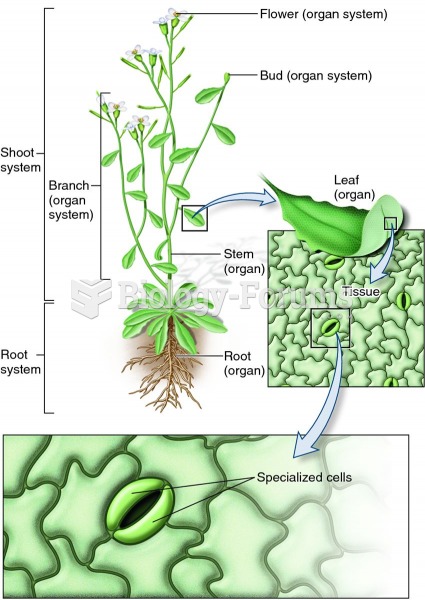 Levels of biological organization in a plant.
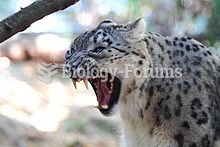 Snow Leopard - Showing teeth at Taronga Zoo, Australia
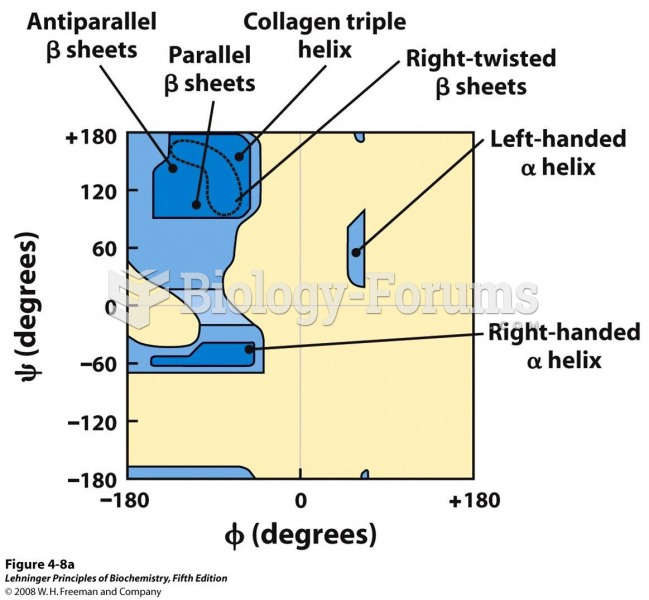 Ramachandran plots showing a variety of structures
 According to this Democratic cartoon, the only qualification of General Zachary Taylor, the Whig can
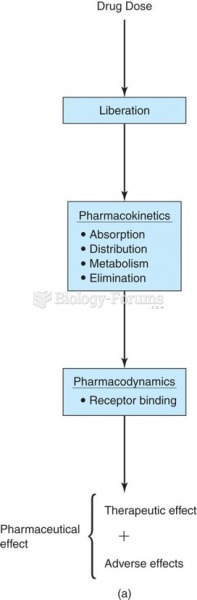 Generalized scheme showing the contribution of absorption, distribution, metabolism, elimination, ...