This topic contains a solution. Click here to go to the answer
|
|
|

 Global view of Mars as seen by the Viking 1 orbiter in 1980, showing the Valles Marineris (center)
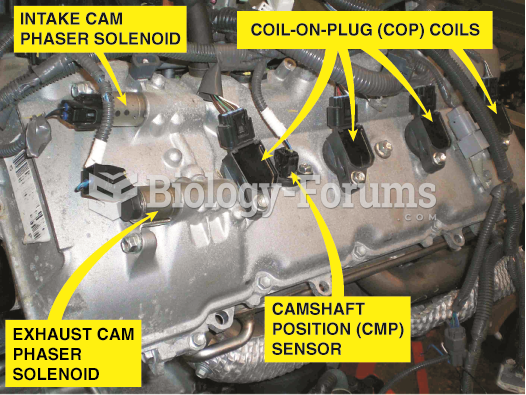 An overhead camshaft engine equipped with variable valve timing on both the intake and exhaust ...
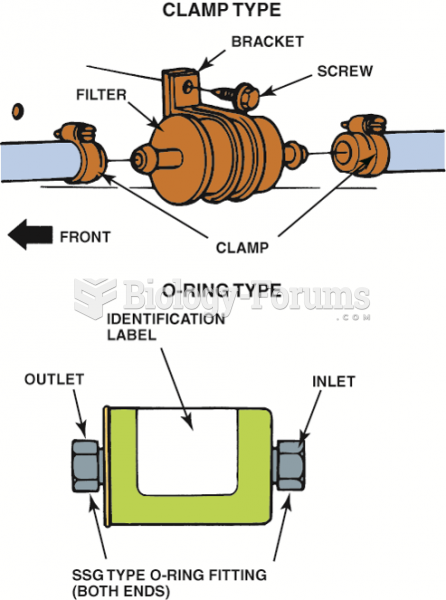 Inline fuel filters are usually attached to the fuel line with screw clamps or threaded ...
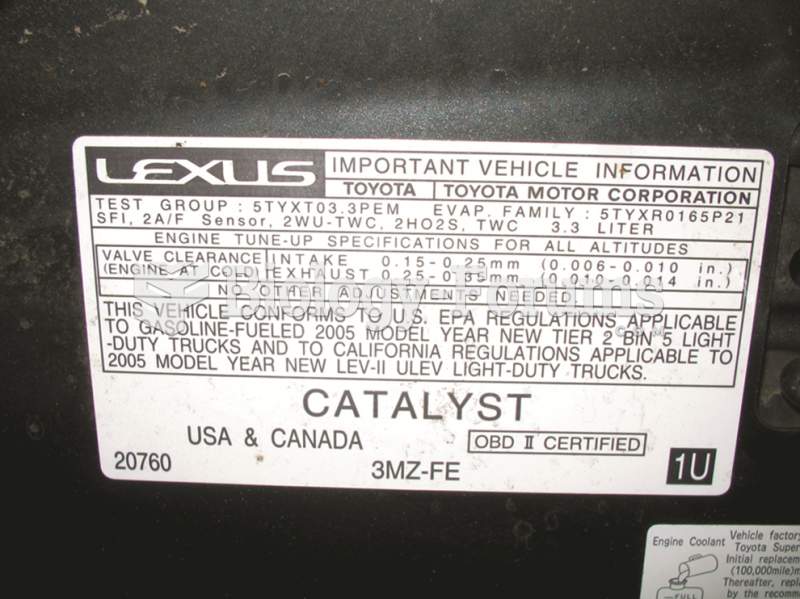 The underhood decal showing that this Lexus RX-330 meets both national (Tier 2; BIN 5) and ...
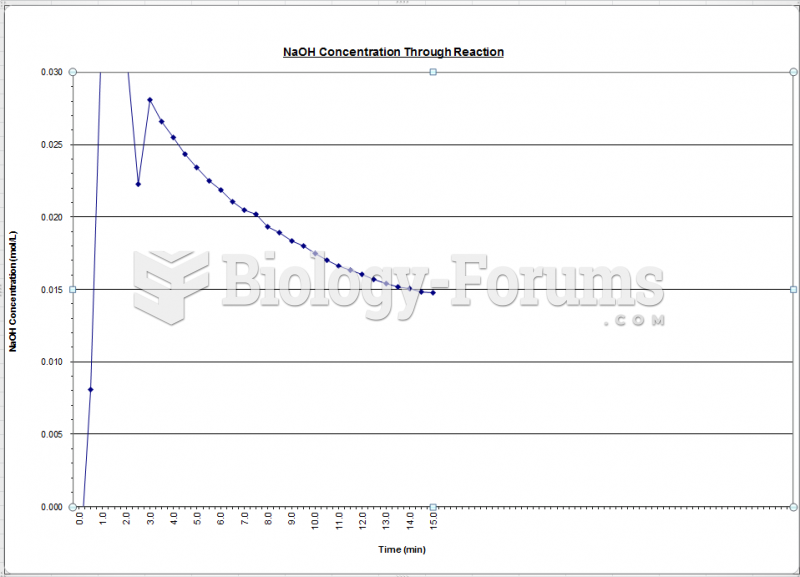 Fluidization - Concentration NaOH Chart
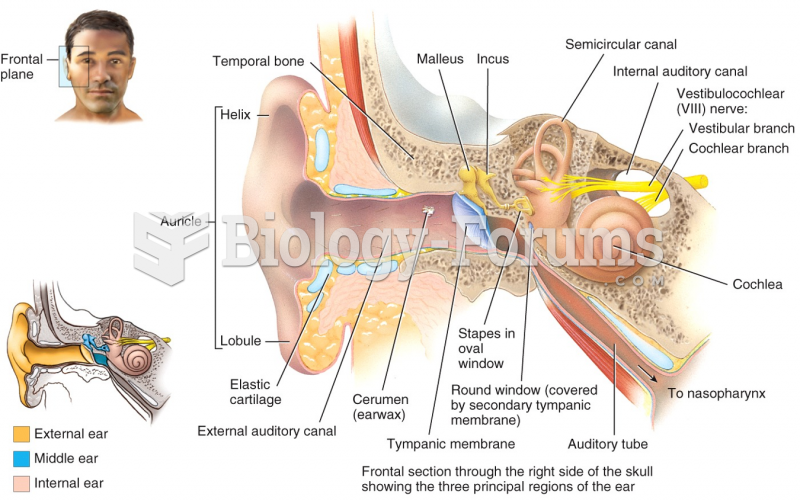 Frontal section through the right side of the skull showing the three principal regions of the ear