This topic contains a solution. Click here to go to the answer
|
|
|

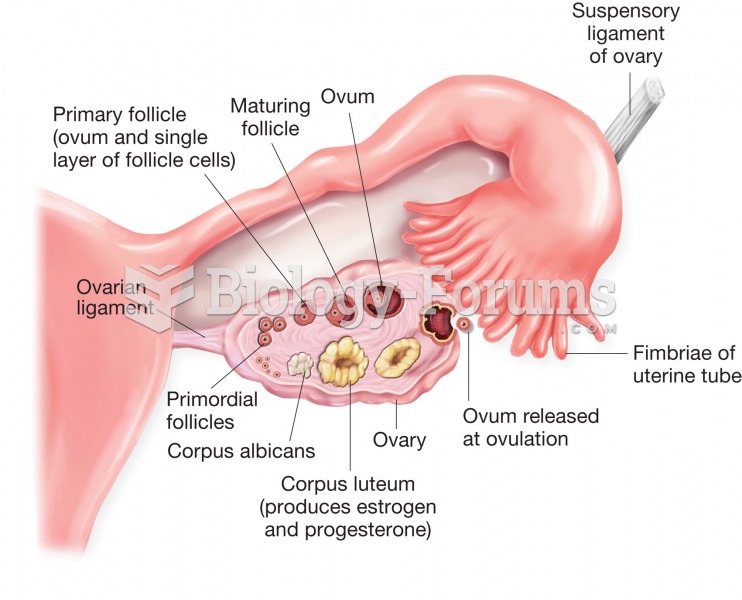 Structure of the ovary and uterine (fallopian) tube. Figure illustrates stages of ovum development a
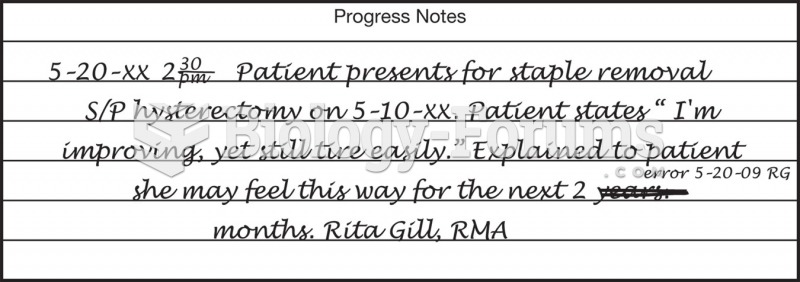 An example of a corrected chart notation.
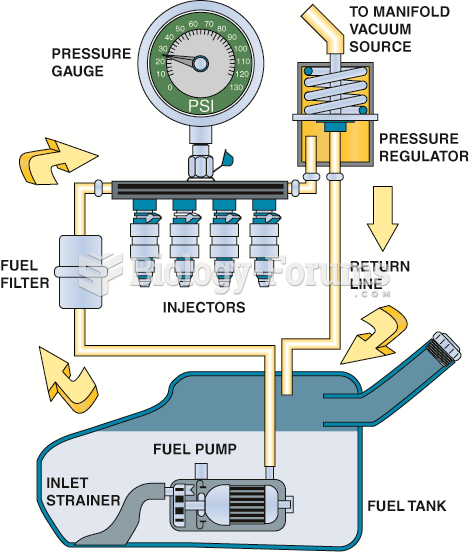 A typical port fuel-injected system showing a vacuum-controlled fuel-pressure regulator.
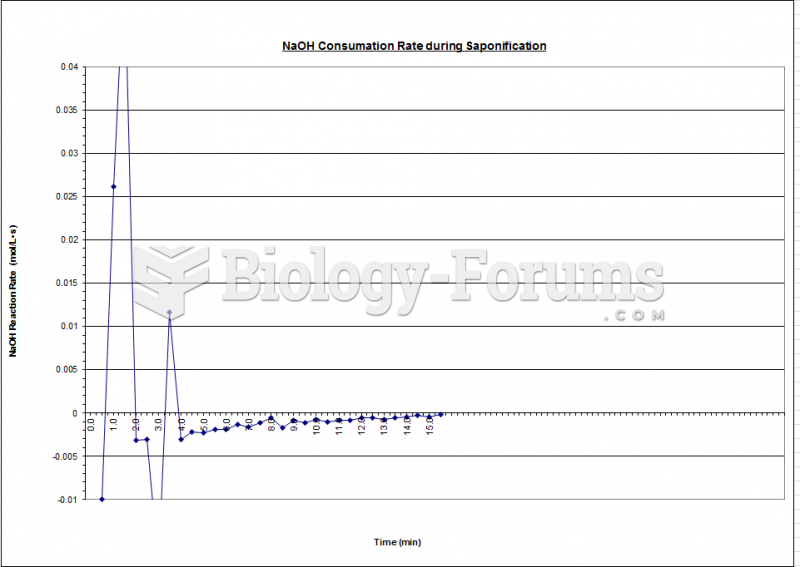 Fluidization - Reaction Rate Chart
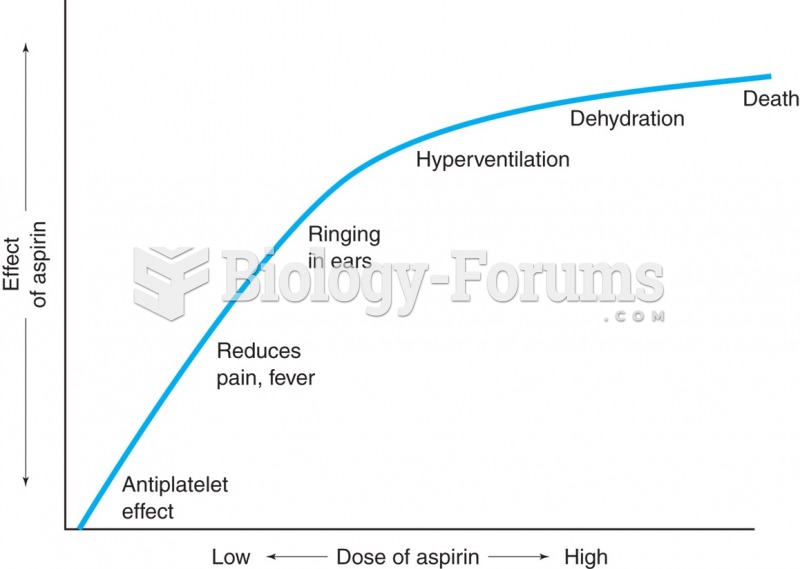 Dose-response relationship. As the dose of a drug increases, a maximal response or plateau is ...
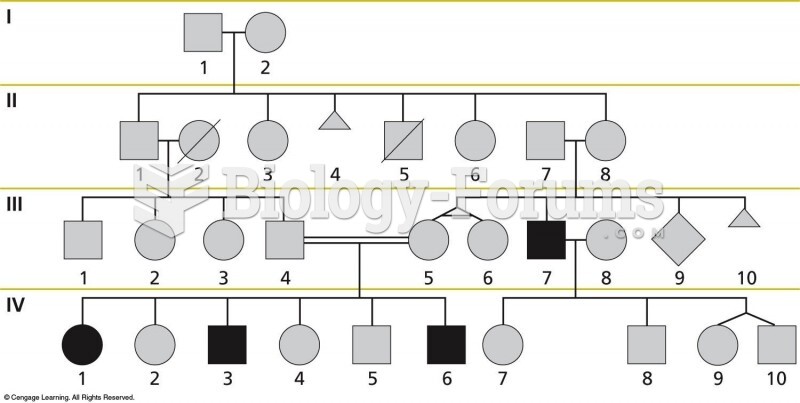 A pedigree showing the inheritance of a trait through several generations of a family.