This topic contains a solution. Click here to go to the answer
|
|
|

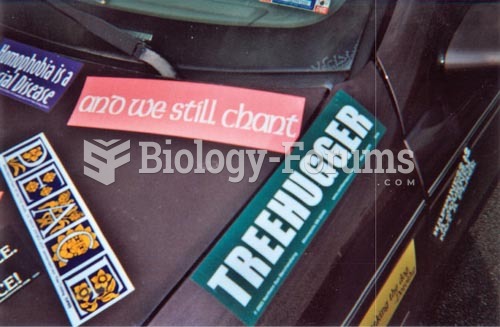 These bumper stickers show an allegiance to New Age religions
 Amino acid chart
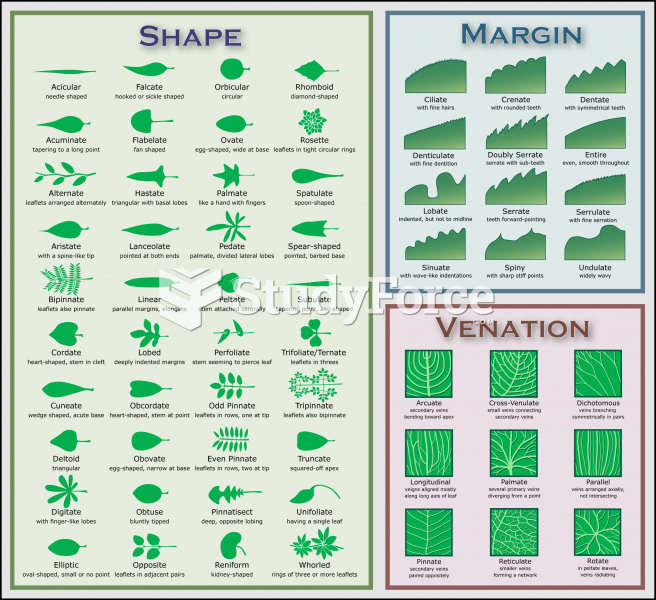 Plant Identification Chart
 Calculus help: Show that y has three points of inflection and they all lie on...
 Find the curved line
 I'm Gonna Show You (Original Mix)