This topic contains a solution. Click here to go to the answer
|
|
|

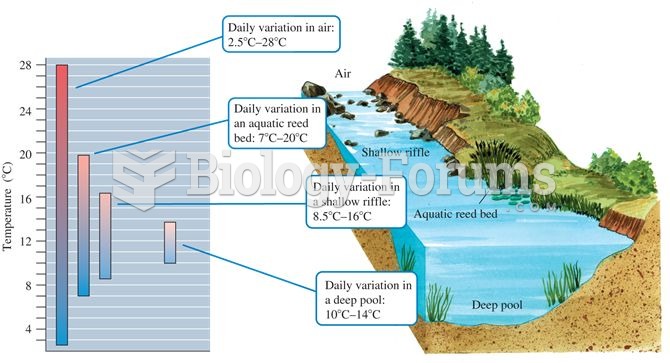 Aquatic microclimates: aquatic environments generally show less temperature variation compared to te
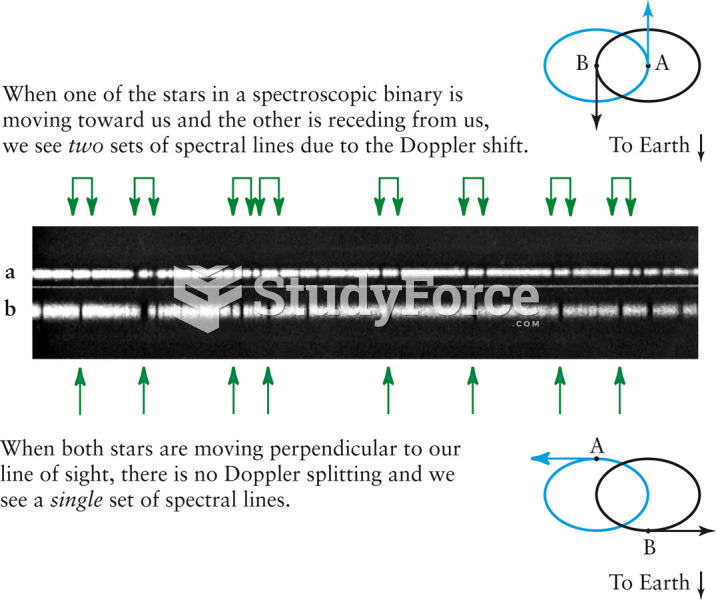 A Double-Line Spectroscopic Binary
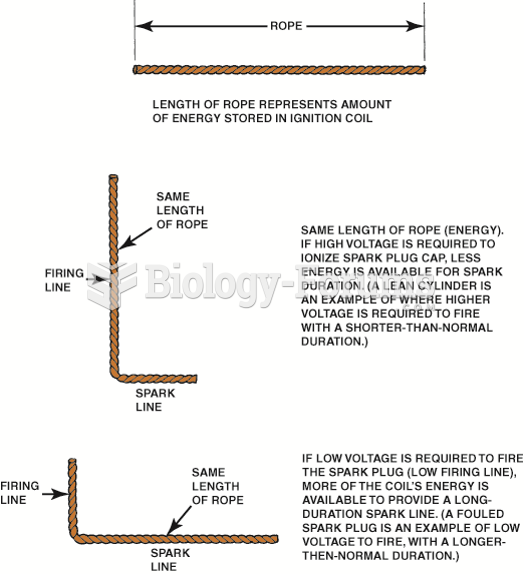 The relationship between the height of the firing line and length of the spark line can be ...
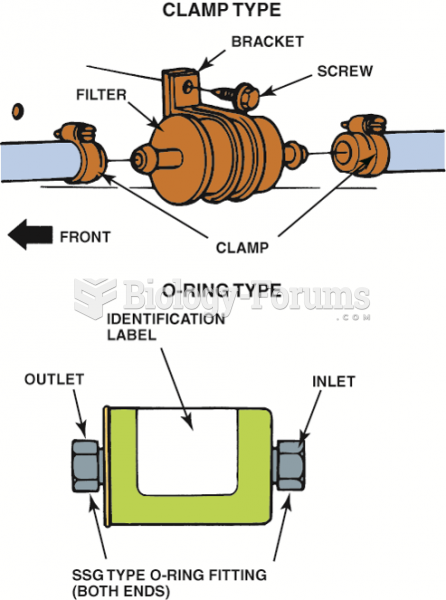 Inline fuel filters are usually attached to the fuel line with screw clamps or threaded ...
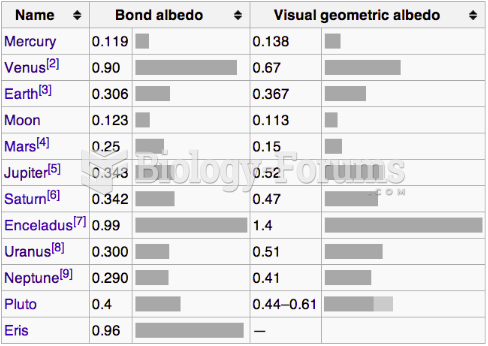 Albedo Chart
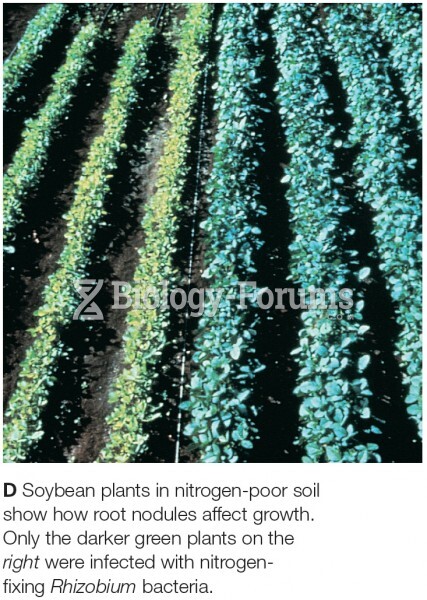 Soybean plants in nitrogen-poor soil show how root nodules affect growth. Only the darker green plan