This topic contains a solution. Click here to go to the answer
|
|
|

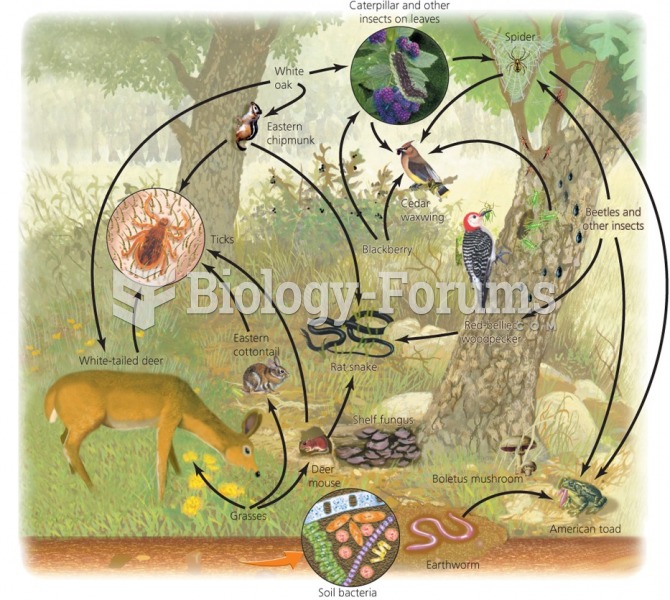 Food webs show feeding relationships and energy flow
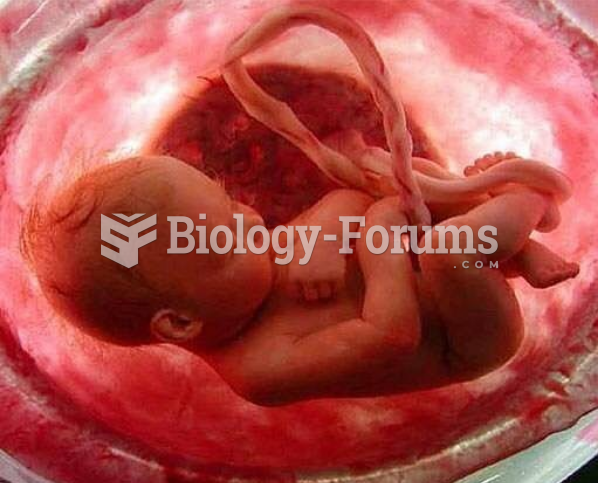 40th Week pregnancy period baby
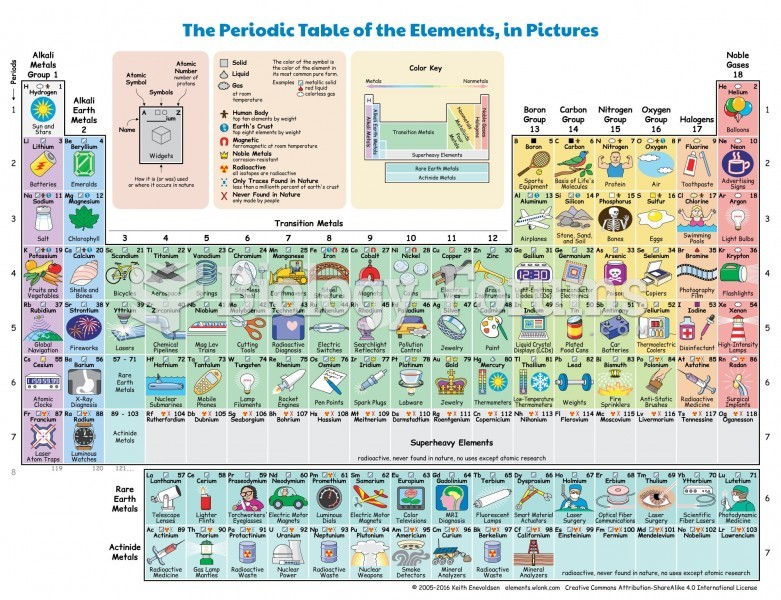 Coolest Period Table EVER
 essay on friendship written by a 10-year-old
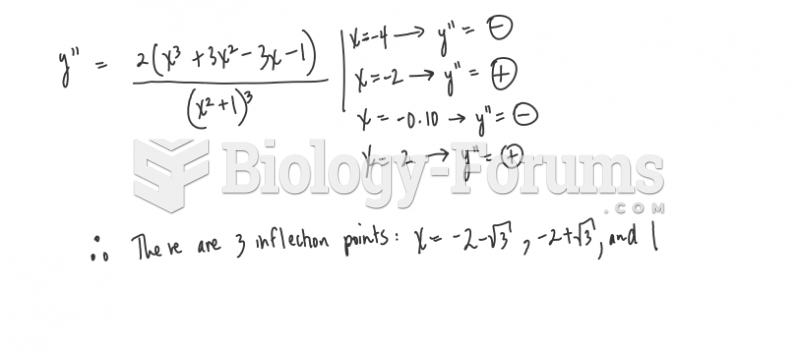 Calculus help: Show that y has three points of inflection and they all lie on...
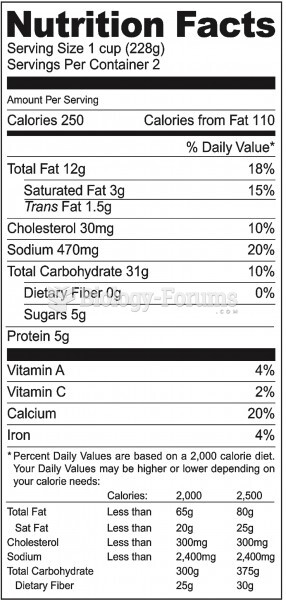 Food Labels Now Show Trans Fats