This topic contains a solution. Click here to go to the answer
|
|
|

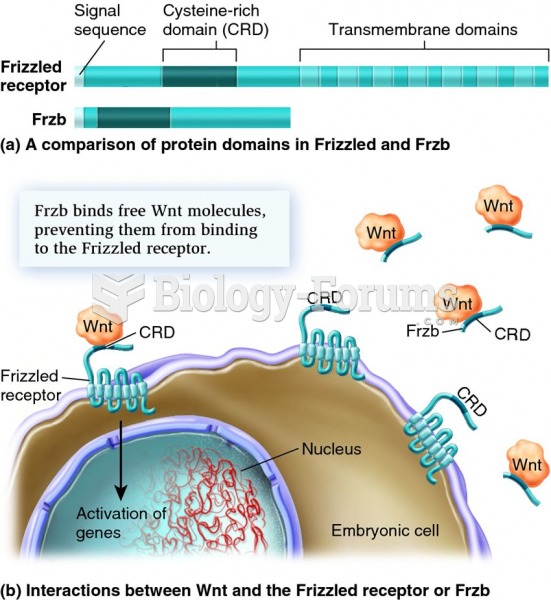 The actions of Frzb and the Frizzled receptor protein show how embryonic development represents a ba
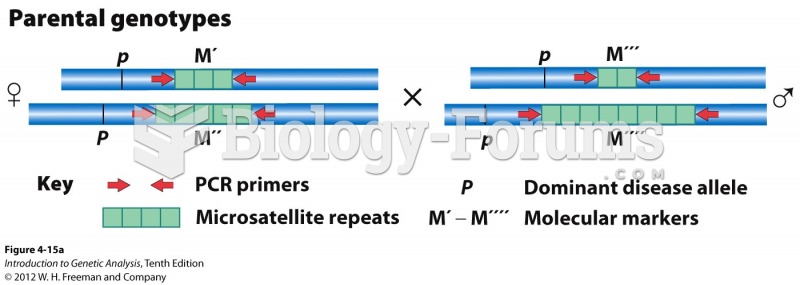 A microsatellite locus can show linkage to a disease gene
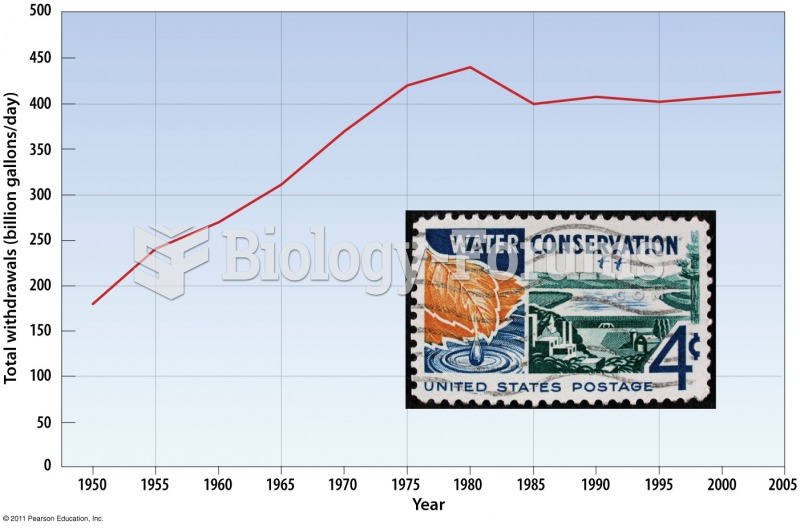 Annual Water Use in the United States
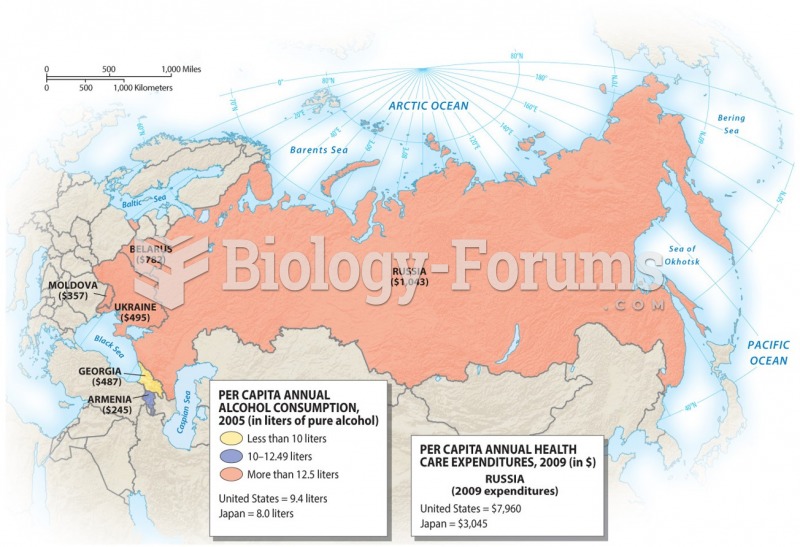 Per capita annual alcohol consumption (2005)
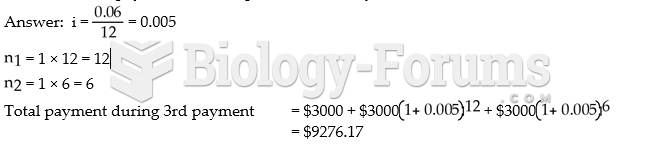 Nader makes semi-annual payments of $3000 to pay off his loan. Because of unemployment, he ...
 Jia's Fashions recently paid a $2 annual dividend. The company is projecting that its ...