This topic contains a solution. Click here to go to the answer
|
|
|

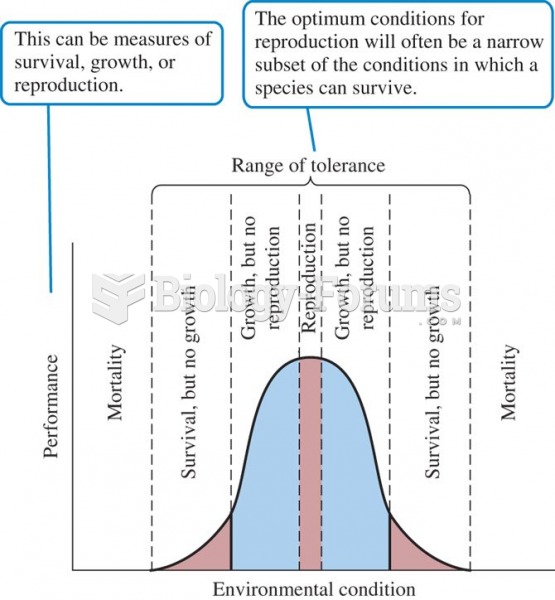 An individual's performance can be limited by environmental conditions, such as temperature. Ac
 L-carnitine is a popular dietary supplement. Notice the claims of improving athletic performance and ...
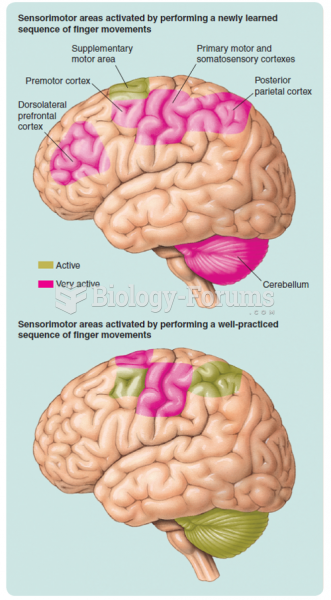 The activity recorded by PET scans during the performance of newly learned and well-practiced ...
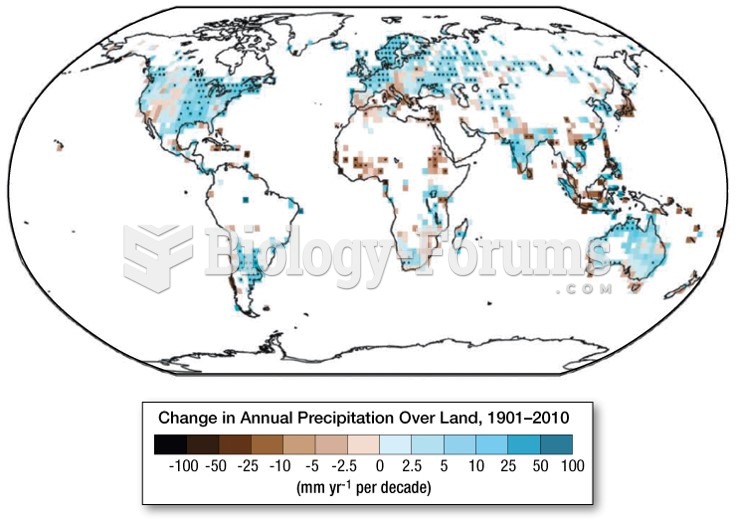 Change in Annual Precipitation Over Land, 1901-2010
 Will Posting Nutritional Content in Restaurants Have a Positive Impact on the Obesity Epidemic?
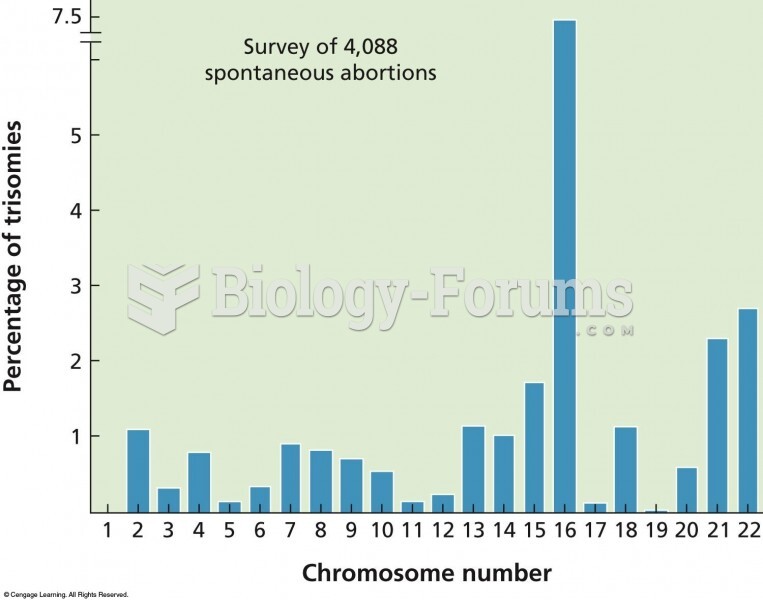 The results of a cytogenetic survey of over 4,000 miscarriages show a wide variation in how often sp