This topic contains a solution. Click here to go to the answer
|
|
|

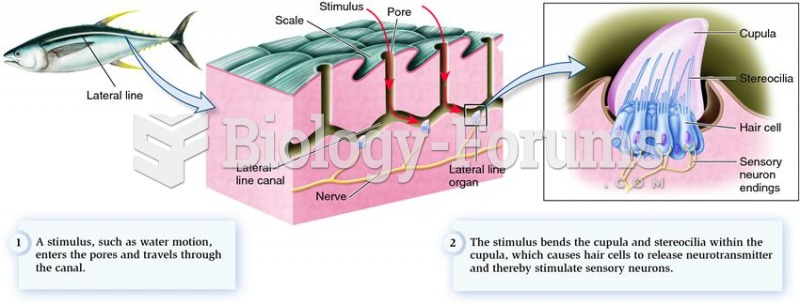 Mechanoreceptors in the lateral line system that detect changes in water movement.
 Detail of the Chinese-style gate of Nishi Hongan-ji in Kyoto; Momoyama period; National Treasure
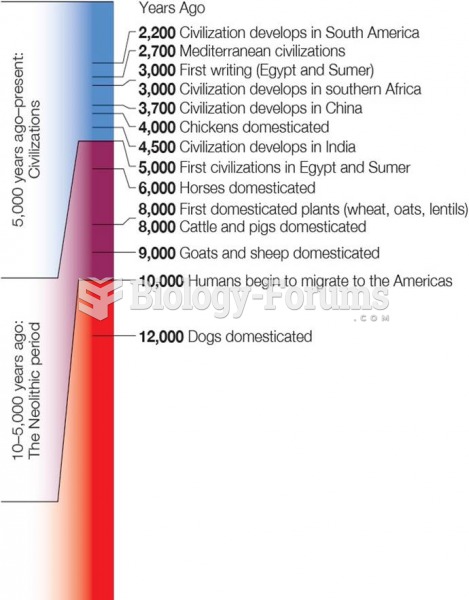 Time Line of Human History From Upper Paleolithic Period to the Present
 Infant: 4 weeks to 1 year.
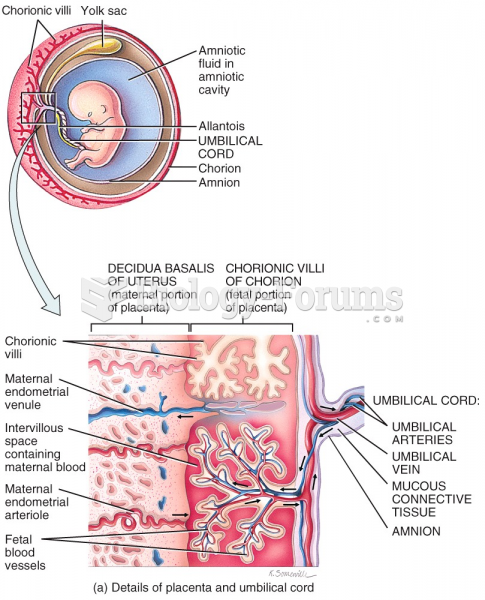 Embryonic Period - 12th week
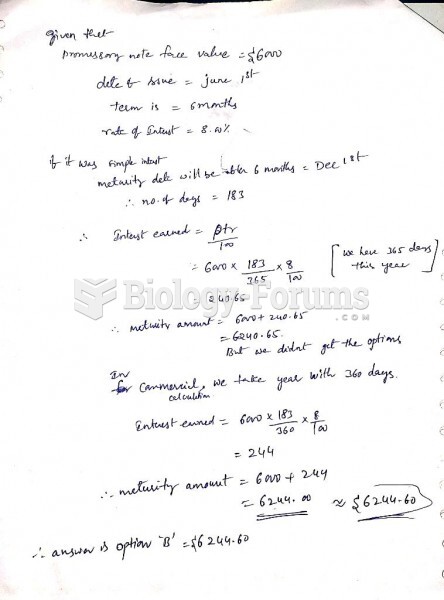 A promissory note has a face value of $6000 and it has a date of issue of June 1 this year. The ...