|
|
|

 Mars's average distance from the Sun is roughly 230 million km (1.5 AU) and its orbital period
 The line that has the yellow tag is a highpressure line and this line must be replaced with a new ...
 Concentration affects where the precipitin line forms. When 1 reactant is held at a constant ...
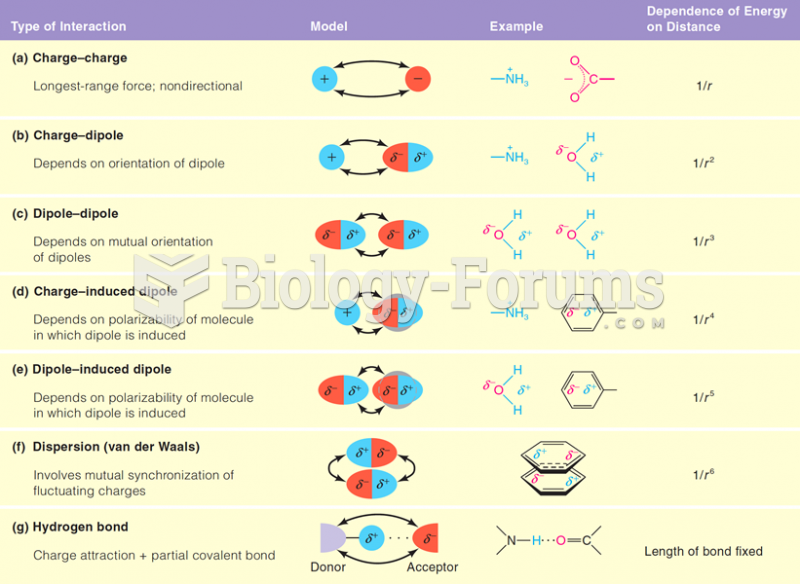 Type of Interactions, Model, Examples and Dependence of Energy on Distance
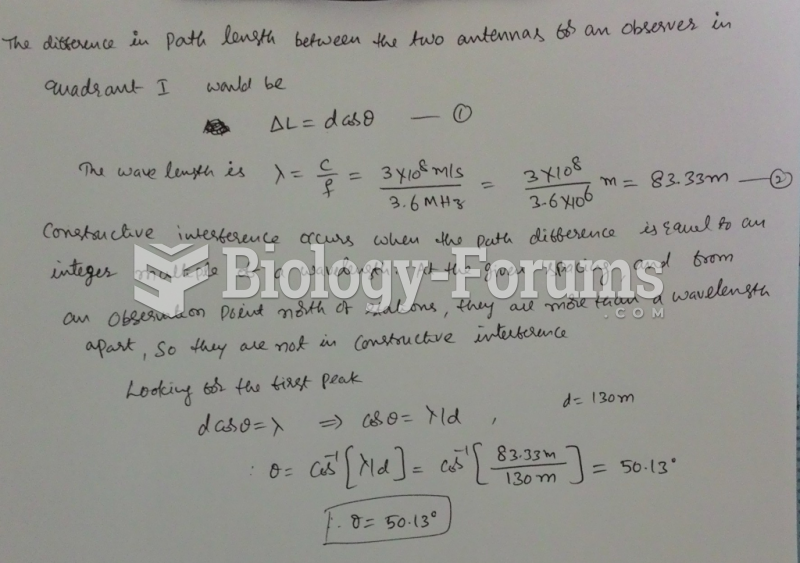 Two radio antennas are 130 m apart on a north-south line. The two antennas radiate in phase at ...
 Physical distance versus recombination distance on human male and female chromosome 19