Visualize independently rising and falling lines that indicate NASDAQ per-share price of
stock for five competing companies on a monthly basis over the past ten years. What is the
term for this type of visual?
a. Bar chart
b. Organization chart
c. Flowchart
d. Graph
Question 2
Visualize a pie-shaped chart in which different-sized wedges indicate the percentage of
market share maintained by individual companies. What is the term for this type of visual?
a. Circle chart
b. Bar chart
c. Organization chart
d. Flowchart

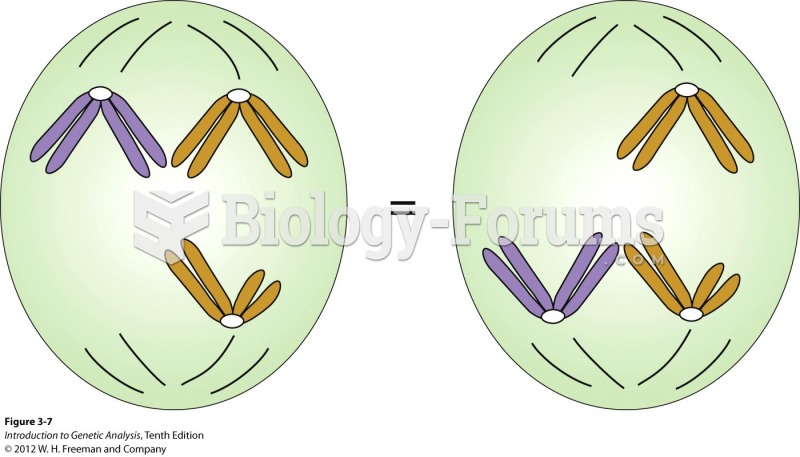 Different chromosomes segregate independently
 Secondary intravenous lines: (a) a tandem intravenous alignment
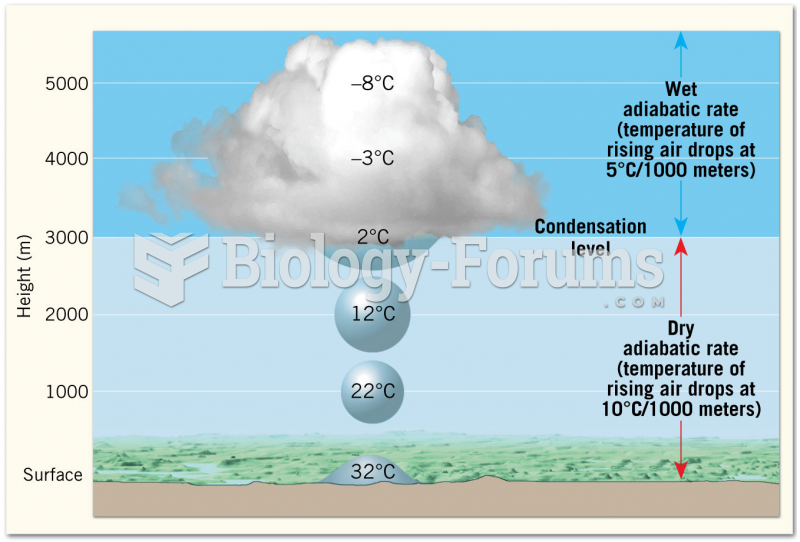 Adiabatic Cooling of Rising Air
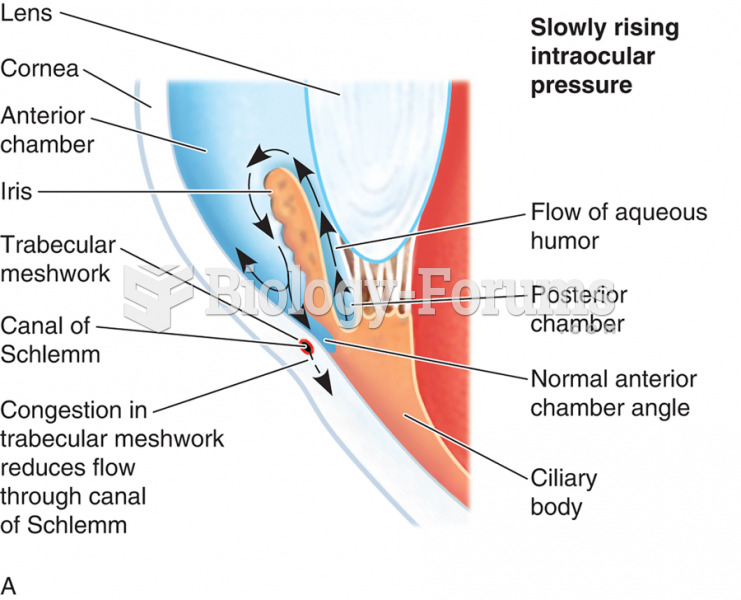 The Pathophysiology of Glaucoma (A) Slowing Rising Intraocular Pressure (I O P)
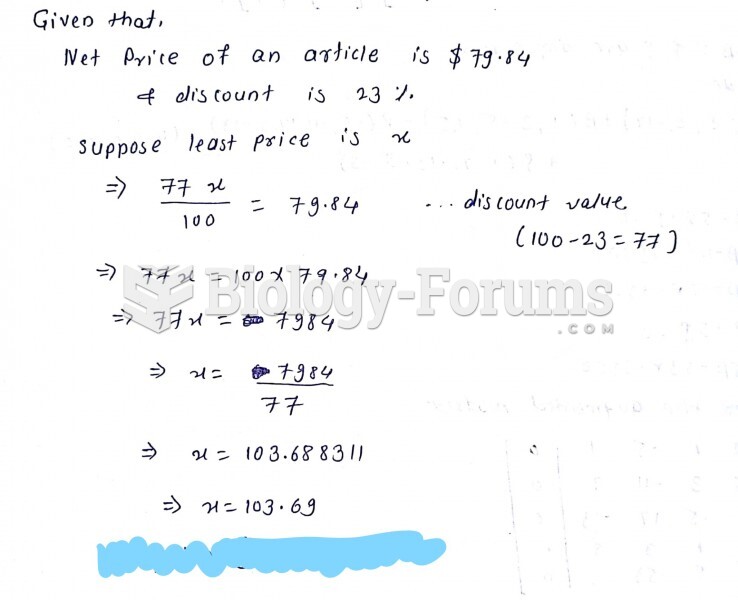 The net price of an article is $79.84. What is the list price if a discount of 23% was allowed?
 Suppose the market supply curve is p = 5Q. If price increases from 10 to 15, the change in ...