Visualize independently rising and falling lines that indicate NASDAQ per-share price of
stock for five competing companies on a monthly basis over the past ten years. What is the
term for this type of visual?
a. Bar chart
b. Organization chart
c. Flowchart
d. Graph
Question 2
Visualize a pie-shaped chart in which different-sized wedges indicate the percentage of
market share maintained by individual companies. What is the term for this type of visual?
a. Circle chart
b. Bar chart
c. Organization chart
d. Flowchart

 Imaginary Thoracic Lines, Posterior View
 This chart shows the various lines of responsibility and how they differ in presidential and parliam
 Walter Thompson saw his assets evaporate during the stock market collapse in 1929. Desperate for ...
 Refraction and the Setting or Rising Sun
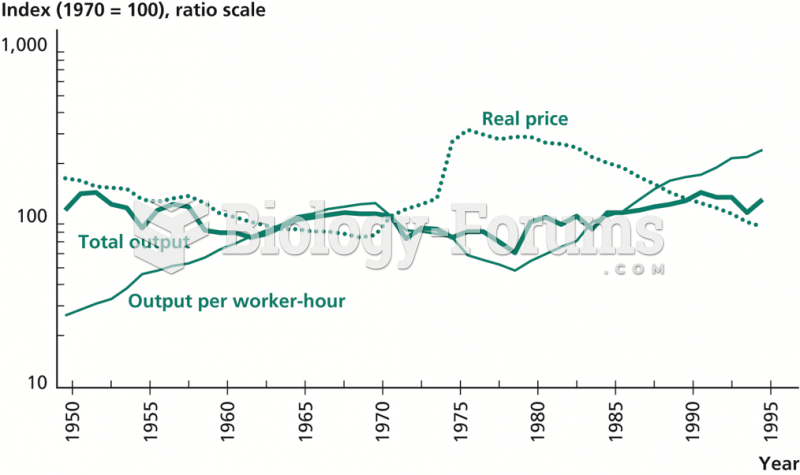 U.S. Subsurface Coal Mining: Output, Price, and Output per Worker-Hour, 1949–1994
 Lines of the posterior thorax