Visualize independently rising and falling lines that indicate NASDAQ per-share price of
stock for five competing companies on a monthly basis over the past ten years. What is the
term for this type of visual?
a. Bar chart
b. Organization chart
c. Flowchart
d. Graph
Question 2
Visualize a pie-shaped chart in which different-sized wedges indicate the percentage of
market share maintained by individual companies. What is the term for this type of visual?
a. Circle chart
b. Bar chart
c. Organization chart
d. Flowchart

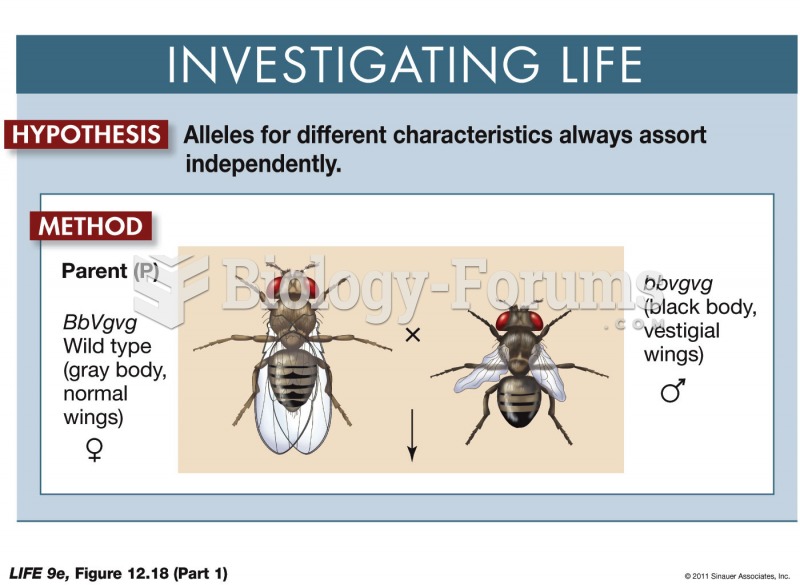 Some Alleles Do Not Assort Independently (Part 1)
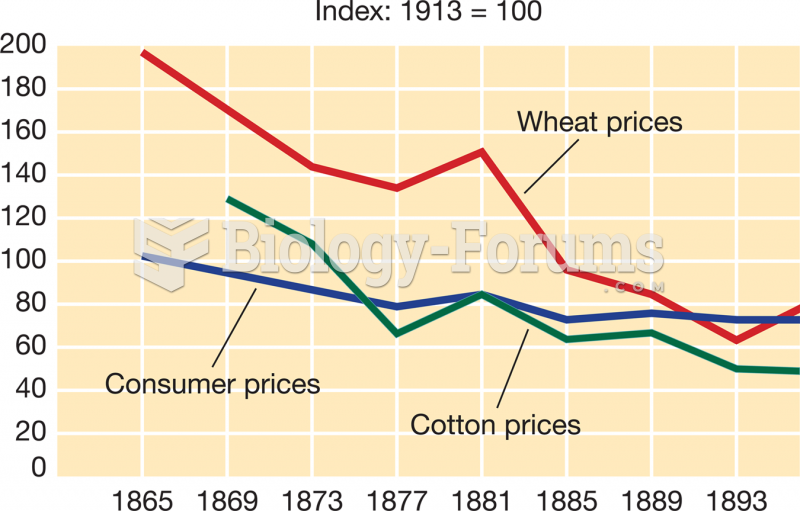 Wheat and Cotton Prices and Consumer Price Indexes, 1865–1896
 Chiropractor (stock image)
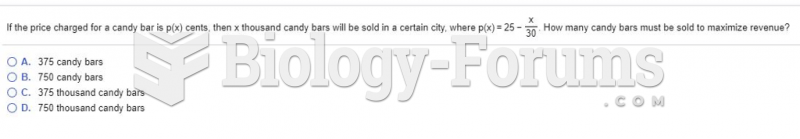 If the price charged for a candy bar is p(x) cents, then x thousand candy bars will be sold in ...
 Suppose the market supply curve is p = 5Q. If price increases from 10 to 15, the change in ...