Visualize independently rising and falling lines that indicate NASDAQ per-share price of
stock for five competing companies on a monthly basis over the past ten years. What is the
term for this type of visual?
a. Bar chart
b. Organization chart
c. Flowchart
d. Graph
Question 2
Visualize a pie-shaped chart in which different-sized wedges indicate the percentage of
market share maintained by individual companies. What is the term for this type of visual?
a. Circle chart
b. Bar chart
c. Organization chart
d. Flowchart

 This chart shows the various lines of responsibility and how they differ in presidential and parliam
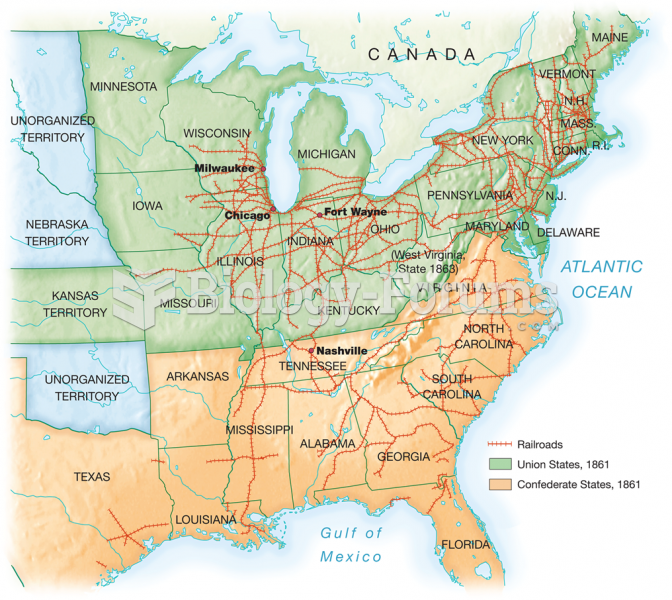 Major trunk lines carrying long-distance traffic crisscrossed the area east of the Mississippi. The
 Refraction and the Setting or Rising Sun
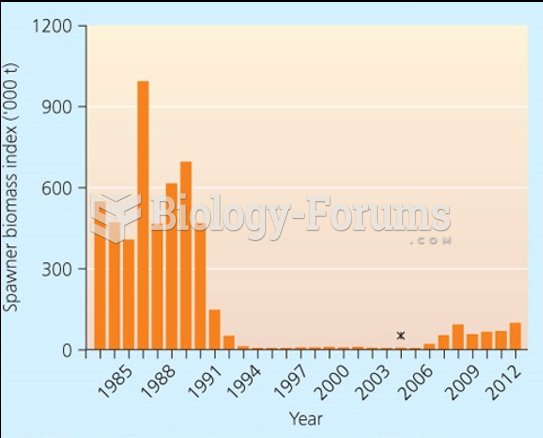 Offshore spawning stock biomass, Grand Bank Atlantic Cod since the early 1980s
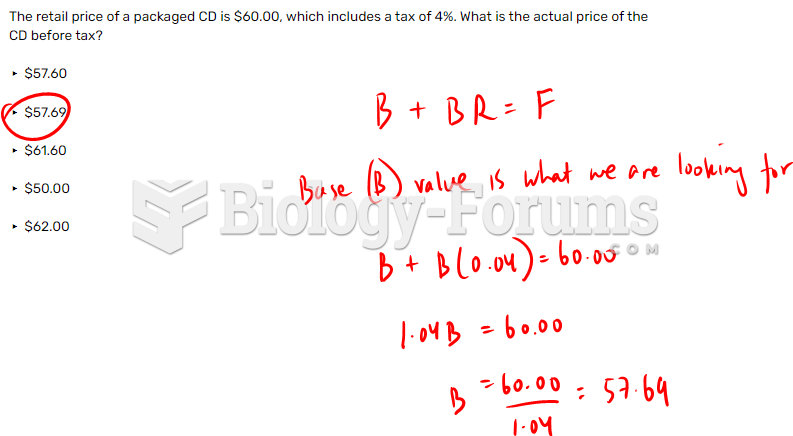 The retail price of a packaged CD is $60.00, which includes a tax of 4%. What is the actual ...
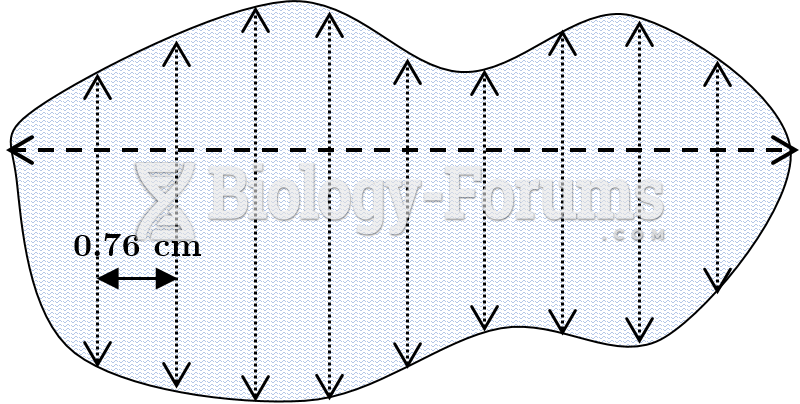 Offset Method Plot of Land with Offset Lines