This topic contains a solution. Click here to go to the answer
|
|
|

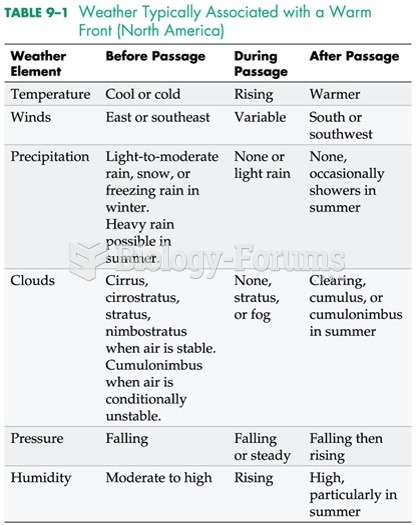 Weather Typically Associated with a Warm Front (North America)
 Figure of a Woman with a Drawing Showing Evidence of Original Painting and Outlining Design Scheme
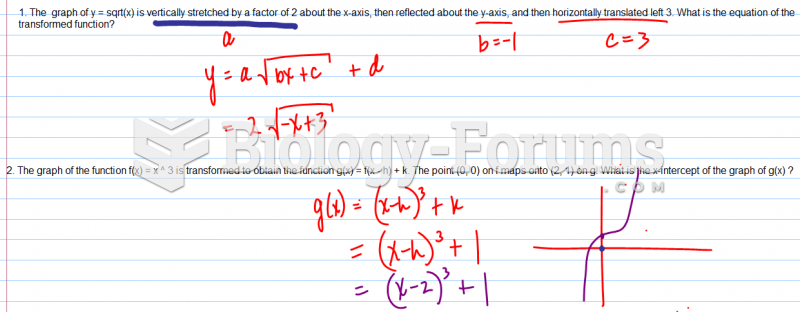 The graph of y = sqrt(x) is vertically stretched by a factor
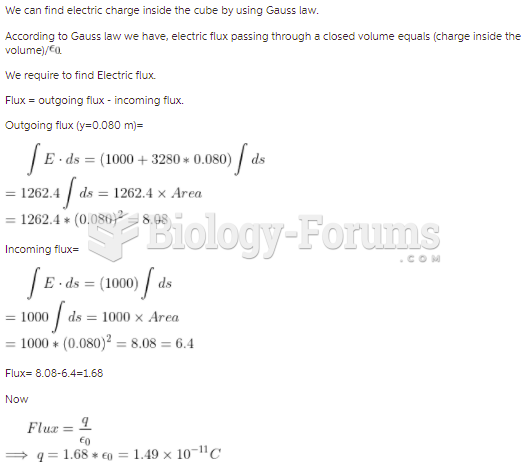 The cube of insulating material shown in the figure has one corner at the origin. Each side of ...
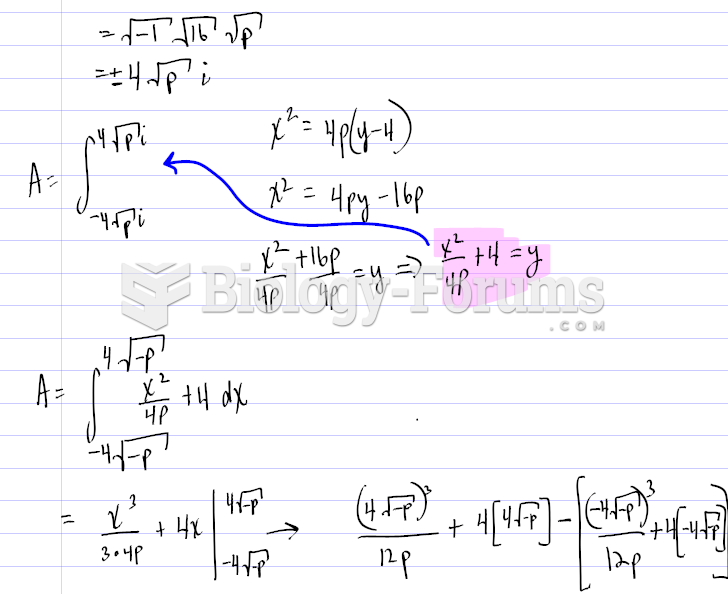 Finding the graph of a Parabola using certain values
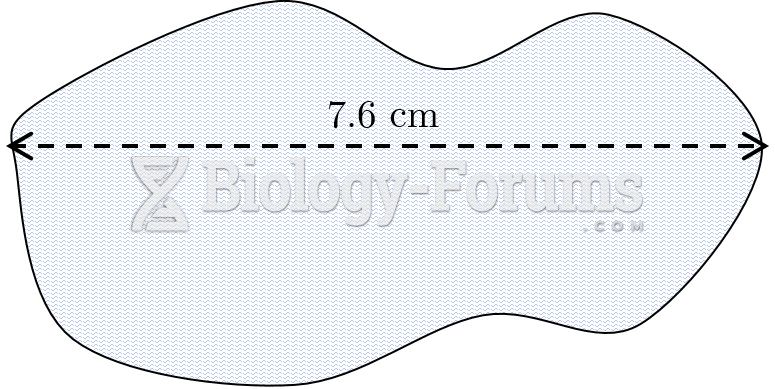 Offset Method Plot of Land with Length Line