When plotting correlational data, the appropriate graph to use is the
a. line graph. c. histogram.
b. bar graph. d. scatterplot.
Question 2
We should do a scatterplot of the data when we compute a correlation because the scatterplot allows us to
a. see the relationship between the two variables.
b. determine the exact value of the correlation coefficient.
c. determine whether a relationship is likely to exist in the population from which the sample is taken.
d. predict accurate Y scores for known X scores.

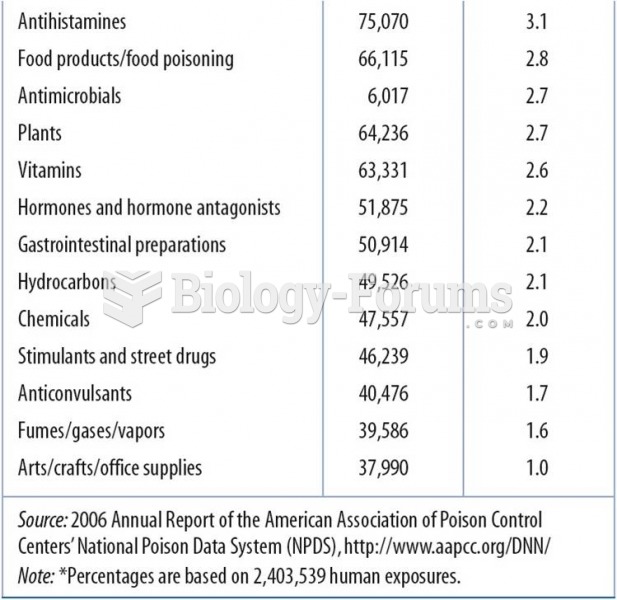 2006 Data:Top 25 Substances Involved in Human Exposures
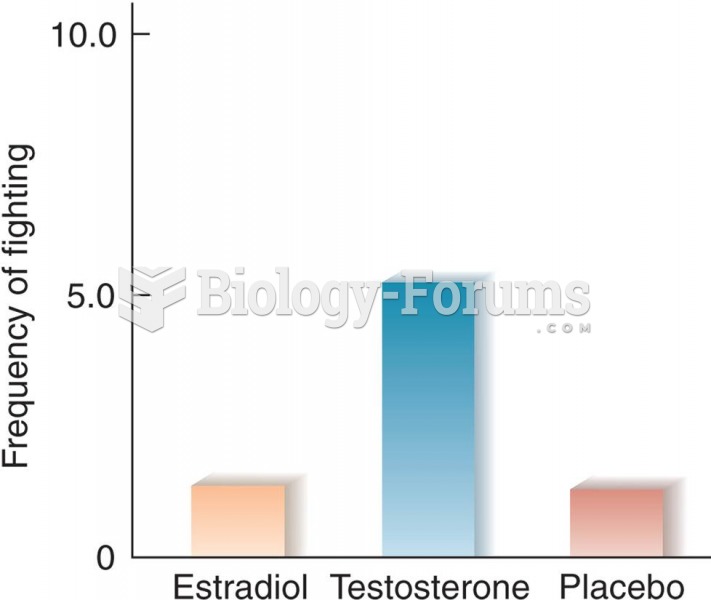 Effects of Estradiol and Testosterone on Interfemale Aggression in Rats (Based on data from van de P
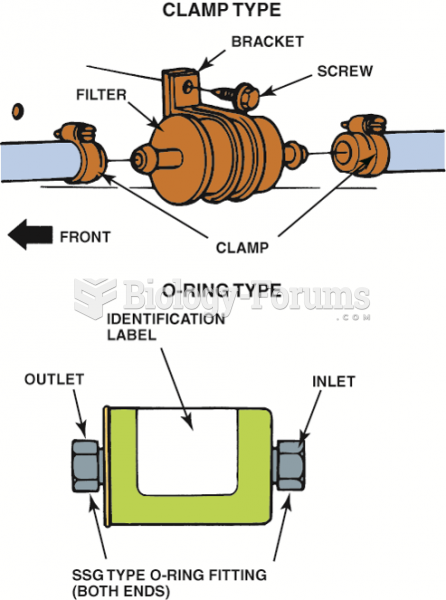 Inline fuel filters are usually attached to the fuel line with screw clamps or threaded ...
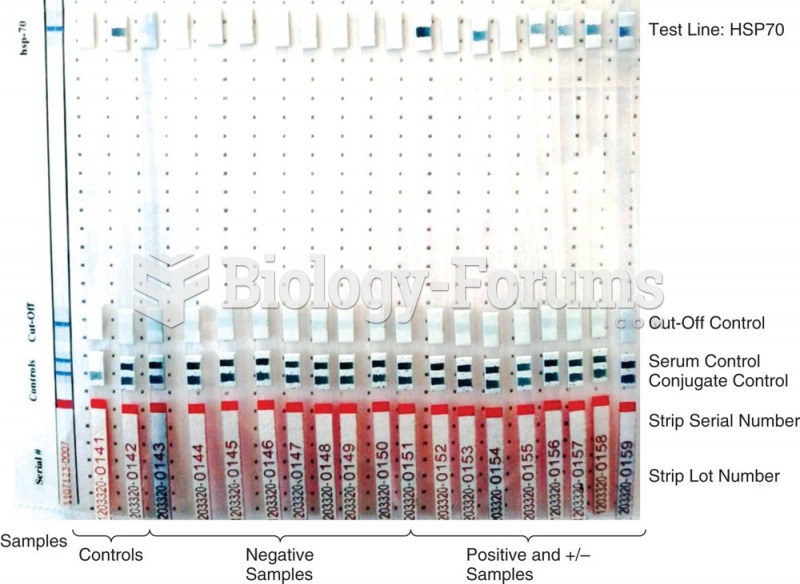 Line immunoassay (LIA), also recombinant immunoblot assay (RIBA) and Immuno-stripe, is similar to a ...
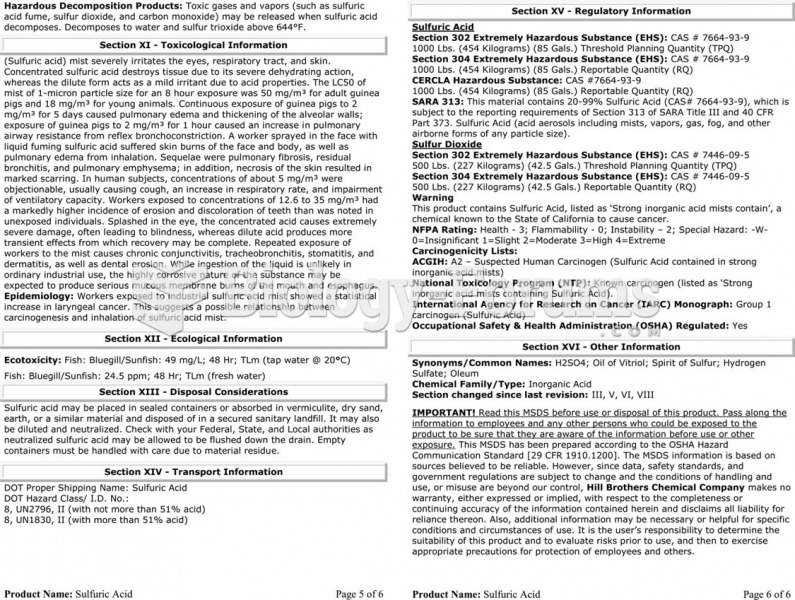 The material safety data sheet (MSDS) for sulfuric acid showing the detailed technical information ...
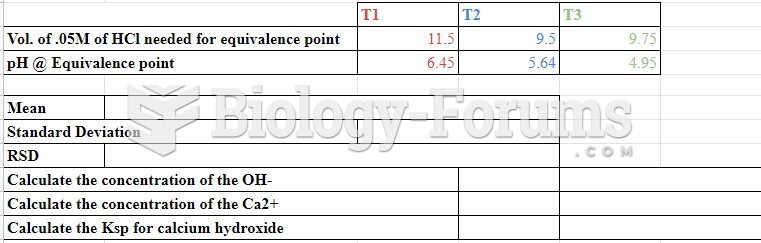 data
data