|
|
|

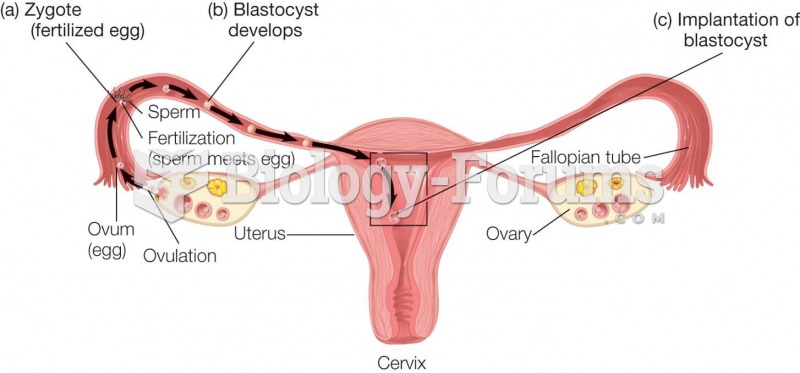 Ovulation Process The two ovaries alternate ovulation in each monthly cycle.
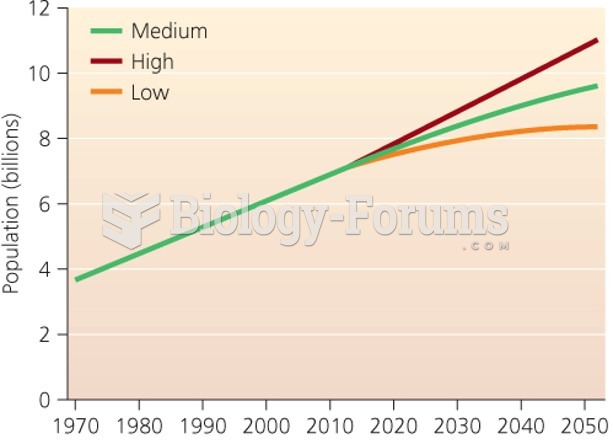 Population size, 1970 - 2050
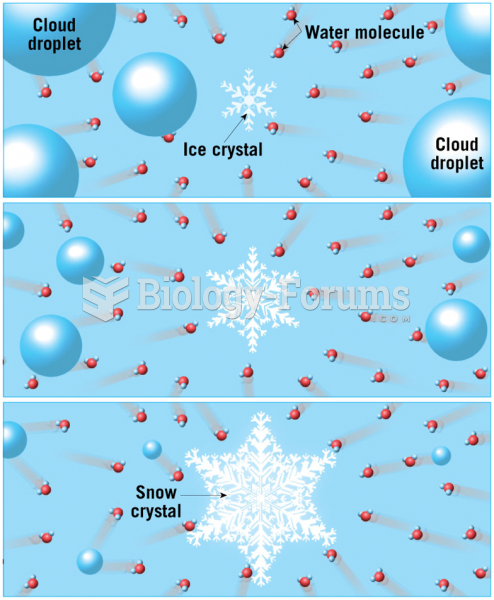 The Bergeron Process
 Average Number of Days per Year with Thunderstorms
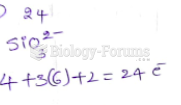 What is the total number of valence electrons in a silicate ion, SiO32-?
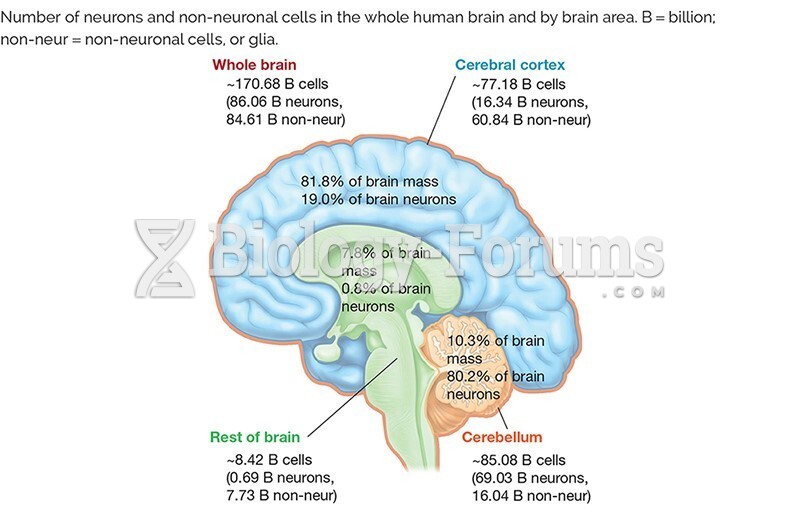 Number of cells in the brain