This topic contains a solution. Click here to go to the answer
|
|
|

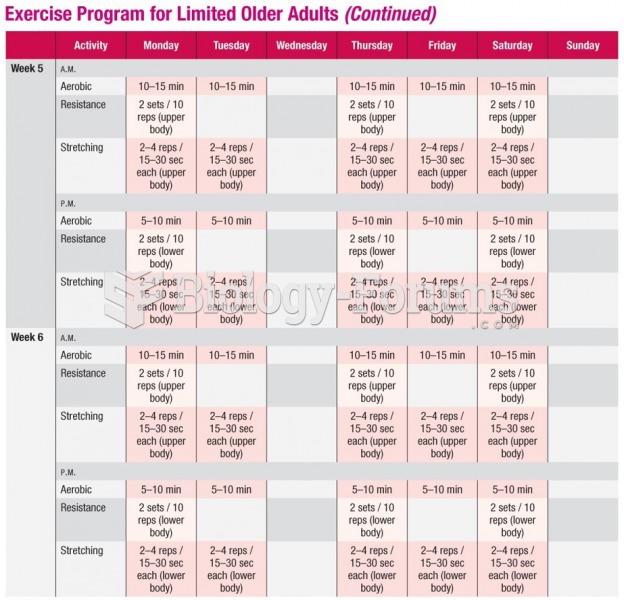 Sample Exercise Program for Limited Older Adults (cont.)
 How to find the quartiles and percentiles for a data set
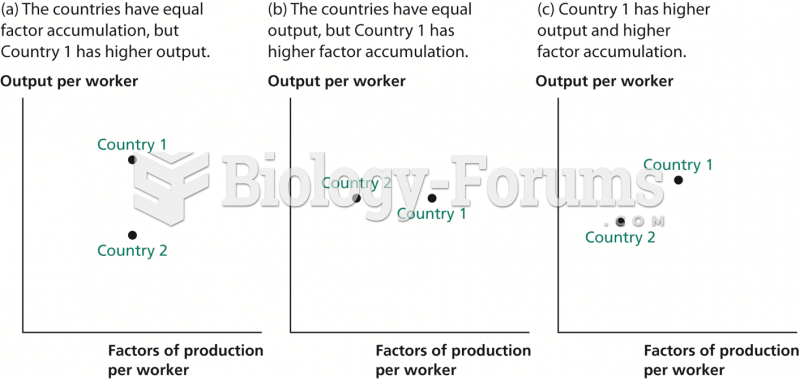 Inferring Productivity from Data on Output and Factor Accumulation
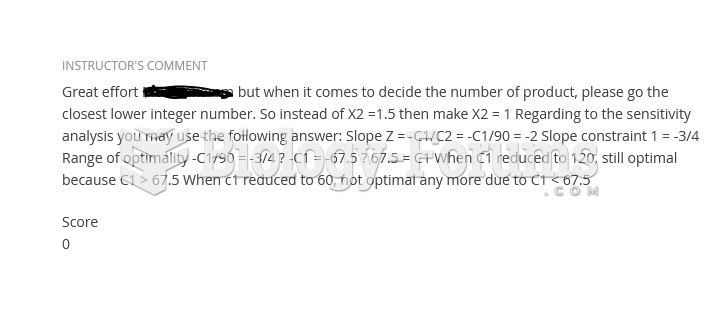
 Linear programming problems using the simplex method.
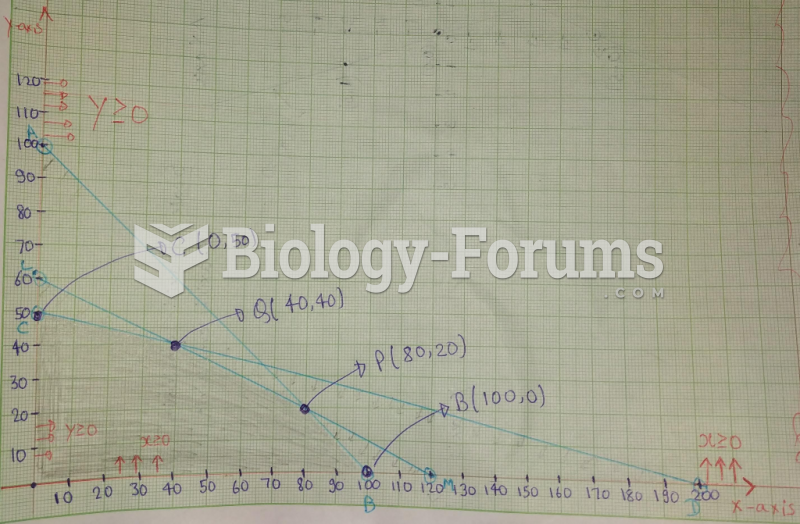
 Linear programming problems
 Data for a Hypothetical Paternity Test Using 13 CODIS Genes