This topic contains a solution. Click here to go to the answer
|
|
|

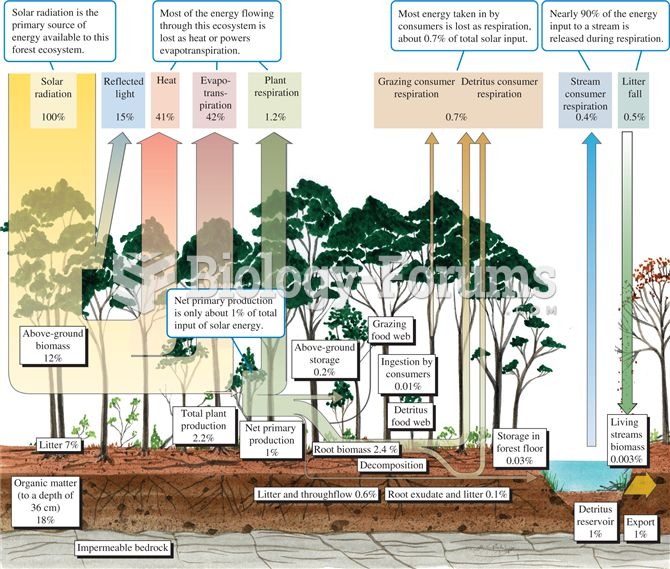 Energy budget for a temperate deciduous forest (data from Gosz et al. 1978).
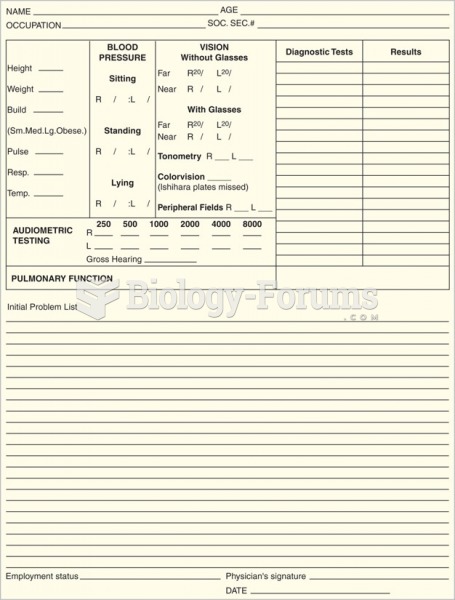 An example of a medical history sheet to list patient problems.
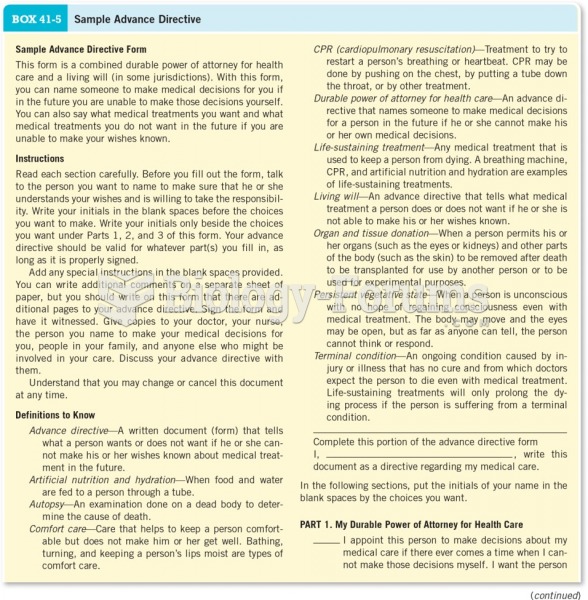 Sample Advance Directive
 How to solve optimization problems in calculus (Part 6)
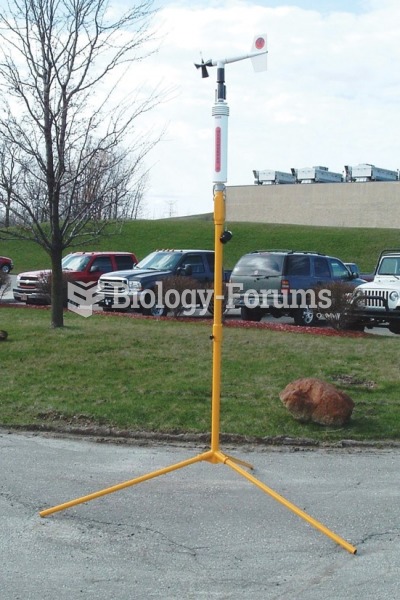 A mobile weather station that can be used to gather current weather data at the scene of hazardous ...
 Abdominal gas "fart problems" غازات البطن