This topic contains a solution. Click here to go to the answer
|
|
|

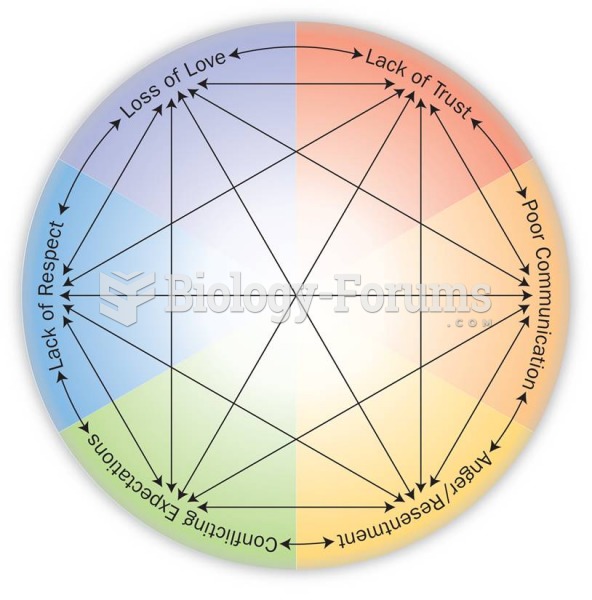 The Circle of Relationship Issues and Sexual Problems
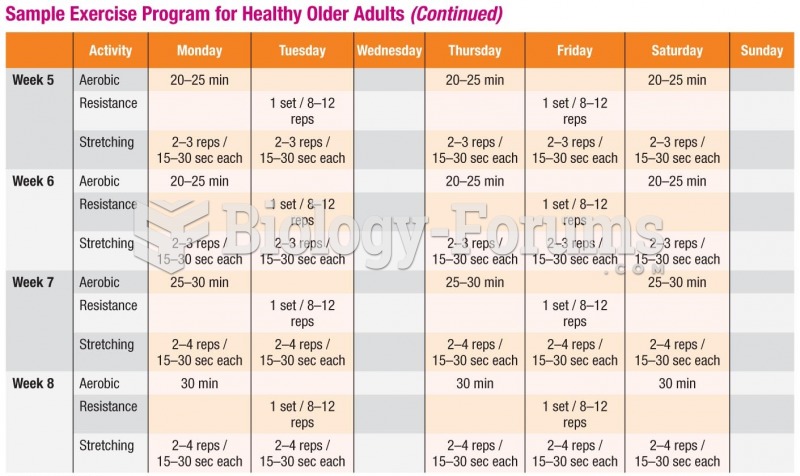 Sample Exercise Program for Healthy Older Adults (cont.)
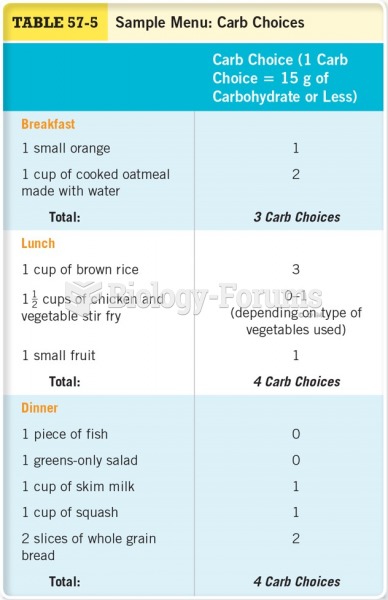 Sample Menu: Carb Choices
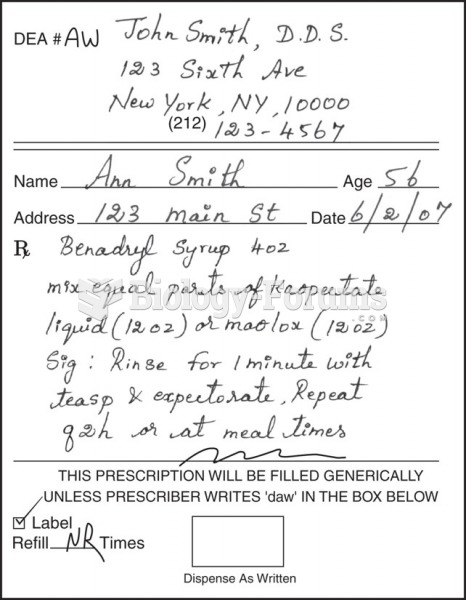 Sample prescriptions of drugs for oral herpes infection.
 How to calculate present value (Question 2)
 How to solve word problems with two unknowns (Question 3)