This topic contains a solution. Click here to go to the answer
|
|
|

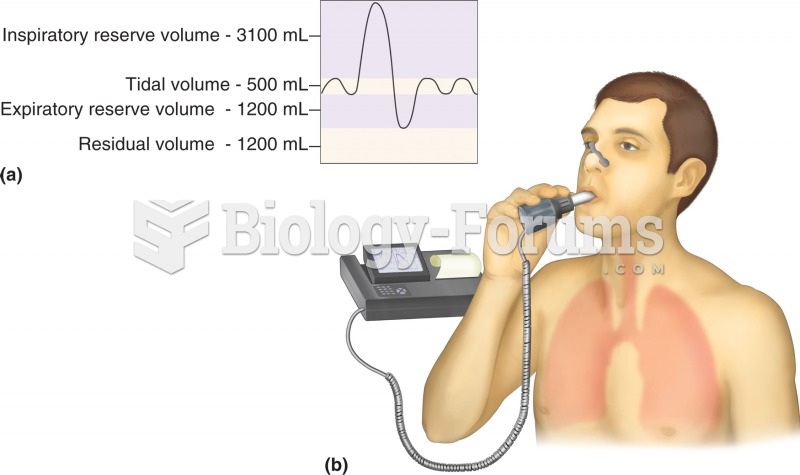 Pulmonary function test: spirometry. (a) Normal respiratory volumes, as measured during spirometry.
 Dimensions for gathering data
 Adapoids and omomyoids had longer snouts and are the first “true” primates.
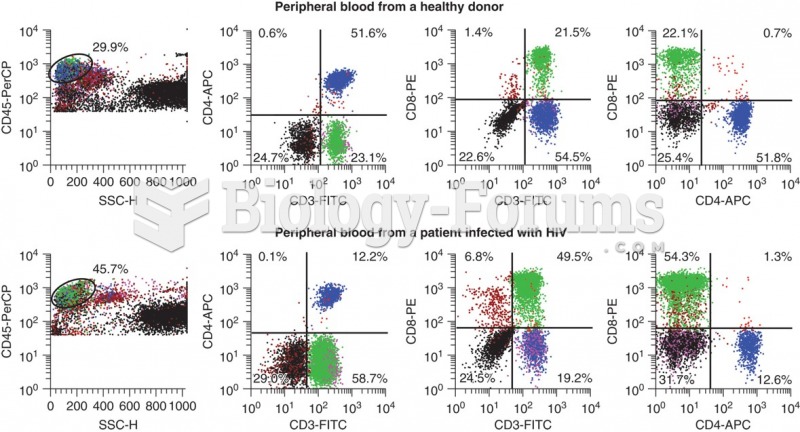 Flow cytometry data that shows the differences in CD3+ CD4+ cells that occur with HIV infection. ...
 Data Used to Analyze Productivity in Country 1 and Country 2
 Satellite data on primary productivity in the equatorial Pacific Ocean