This topic contains a solution. Click here to go to the answer
|
|
|

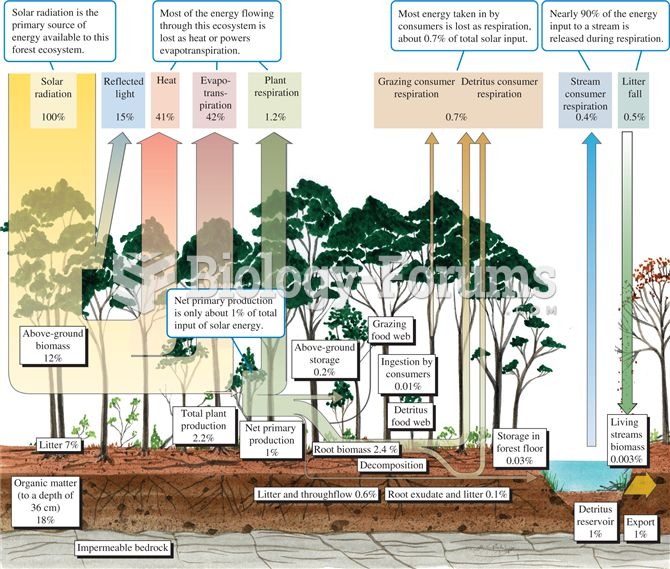 Energy budget for a temperate deciduous forest (data from Gosz et al. 1978).
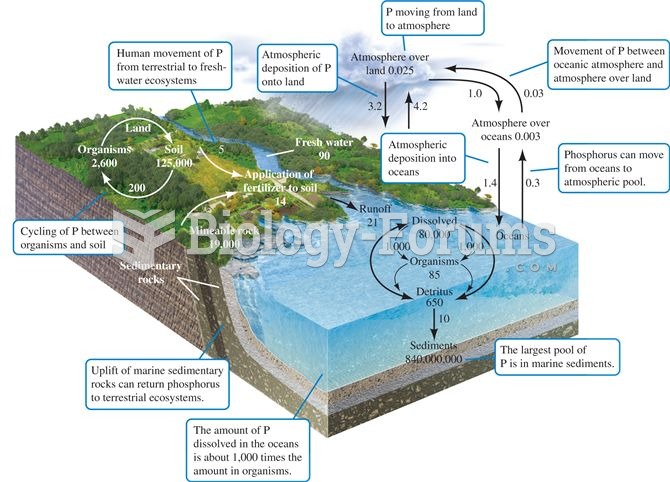 The phosphorus cycle. Numbers are 1012 g P or fluxes as 1012 g P per year (data from Schlesinger 199
 A true albino squirrel. Note the pink eyes.
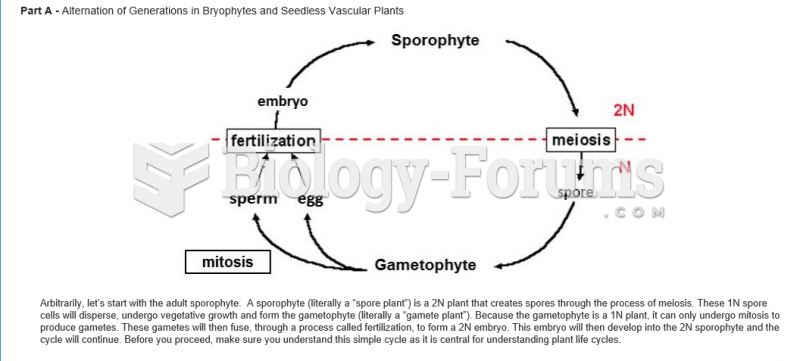 Which is TRUE about the alternation of generations cycle that is diagramed above?
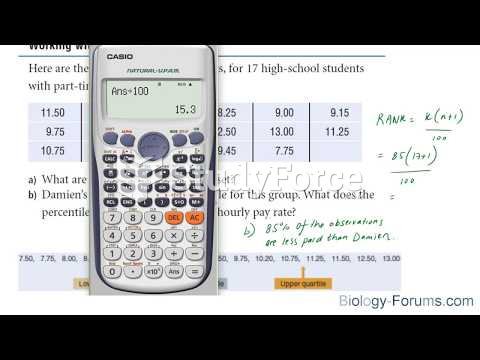 How to find the quartiles and percentiles for a data set
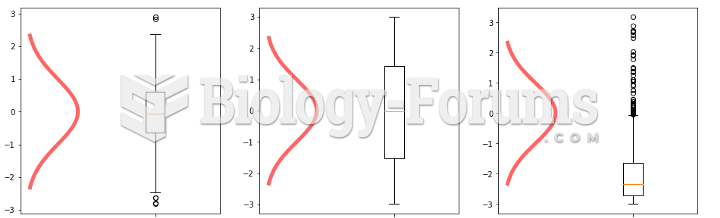 Histograms - Analysis and Data