This topic contains a solution. Click here to go to the answer
|
|
|

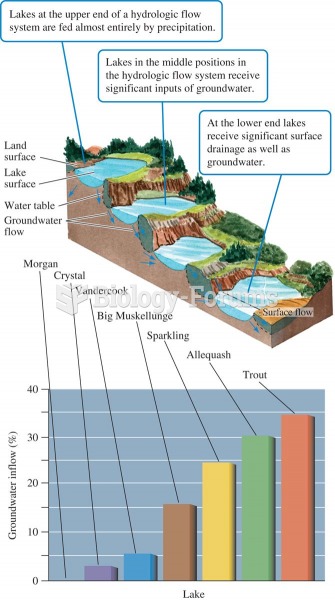 Lake position in the landscape and proportion of water received as groundwater (data from Webster et
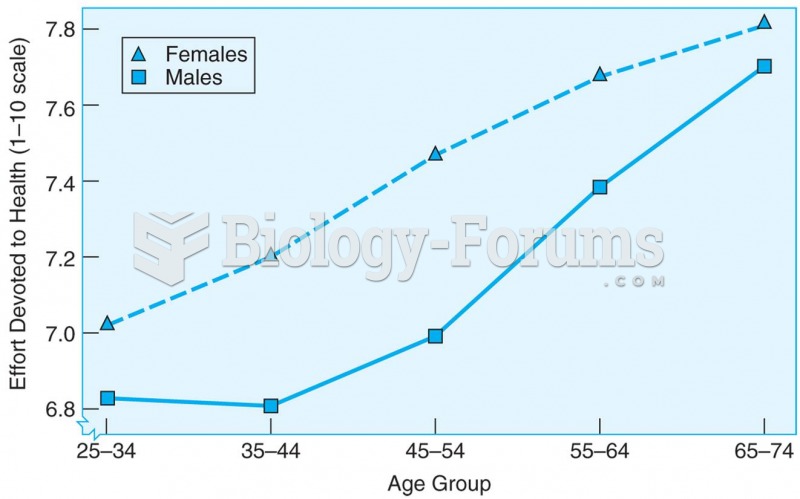 Cross-sectional data showing that the amount of effort spent on personal health care increases with
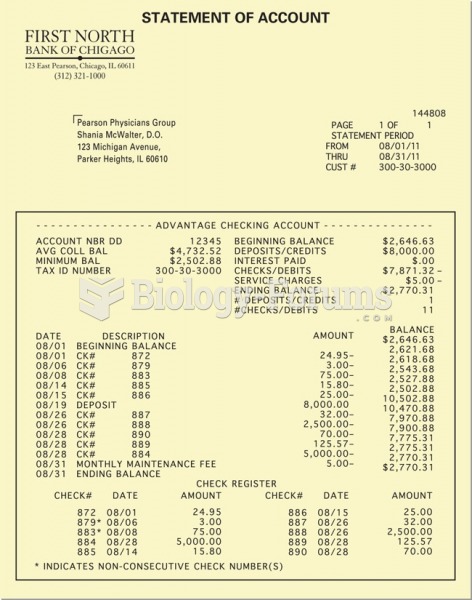 A typical bank statement.
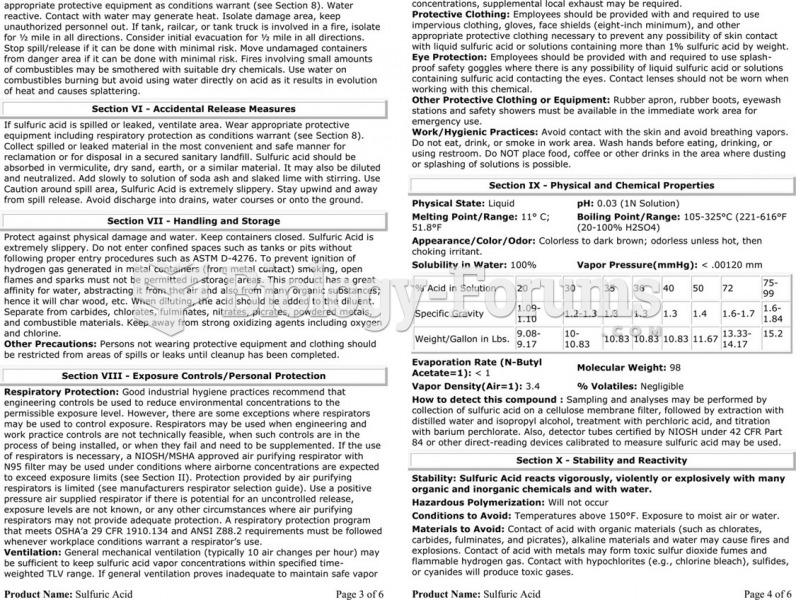 The material safety data sheet (MSDS) for sulfuric acid showing the detailed technical information ...
 Demographic Data for India
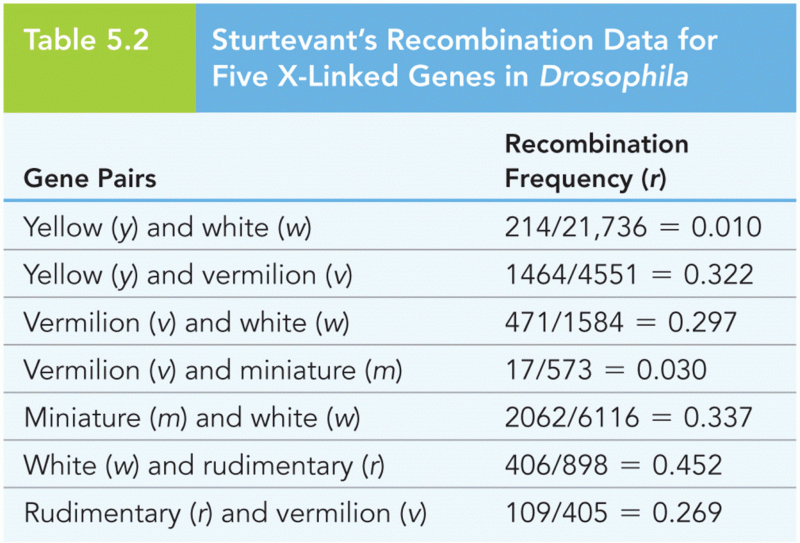 Sturtevant’s Recombination Data for Five X-Linked Genes in Drosophila