This topic contains a solution. Click here to go to the answer
|
|
|

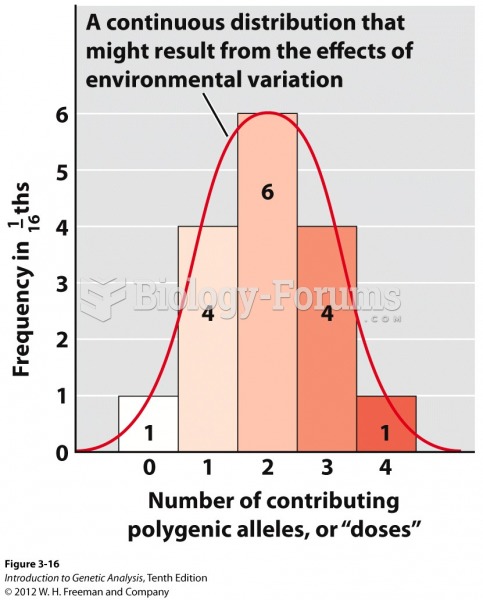 Histogram of polygenes from a dihybrid self
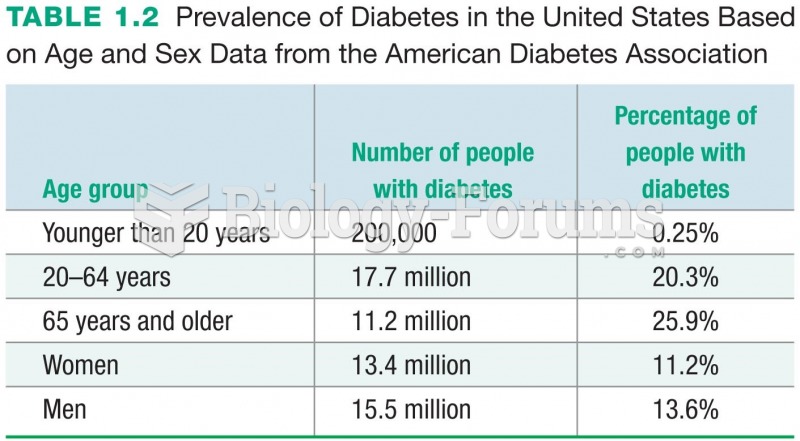 Prevalence of Diabetes in the United States Based on Age and Sex Data from the American Diabetes ...
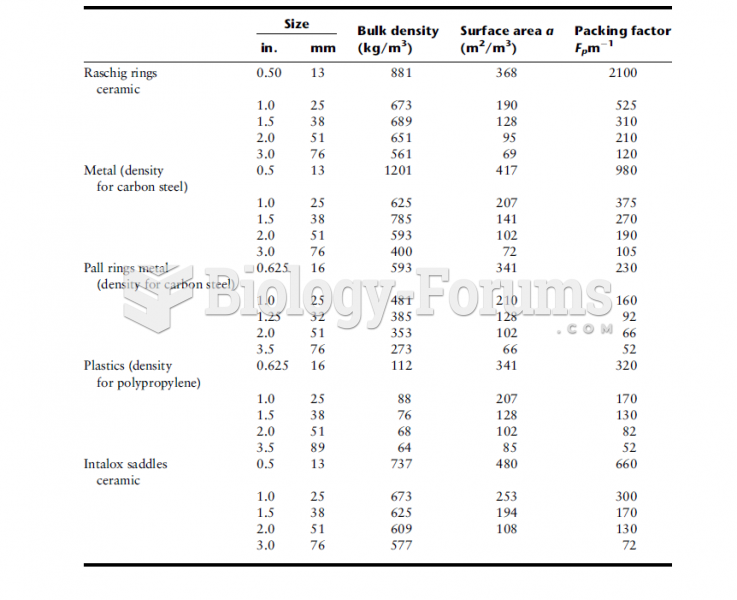 Design Data for Various Packings
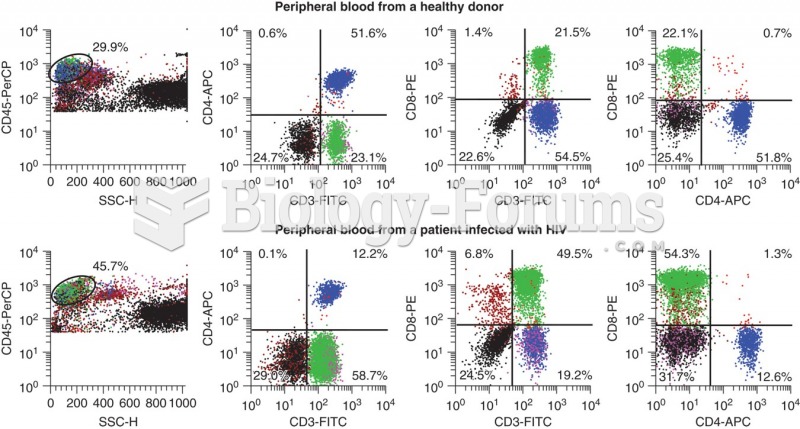 Flow data for a healthy donor (top panel) and a HIV positive patient. CD3 is a T-cell marker, CD4 is ...
 Basic Marketing Research: Using Microsoft Excel Data Analysis
 data
data