|
|
|

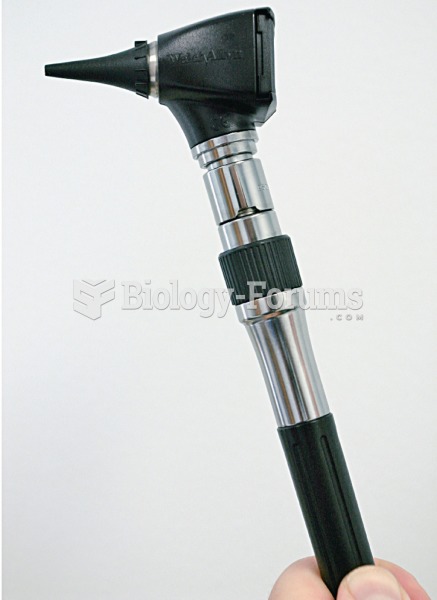 An otoscope, used to visually examine the external auditory ear canal and tympanic membrane.
 A health history is essential in collecting subjective data about metabolic acidosis.
 Amazing NASA Pictures Collection
 Amazing NASA Pictures Collection
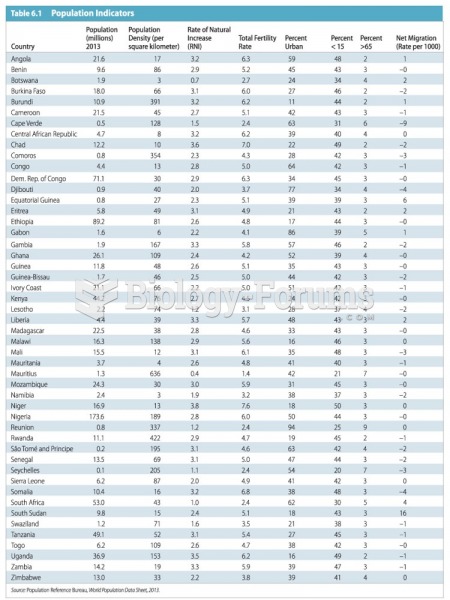 Demographic Trends and Debates
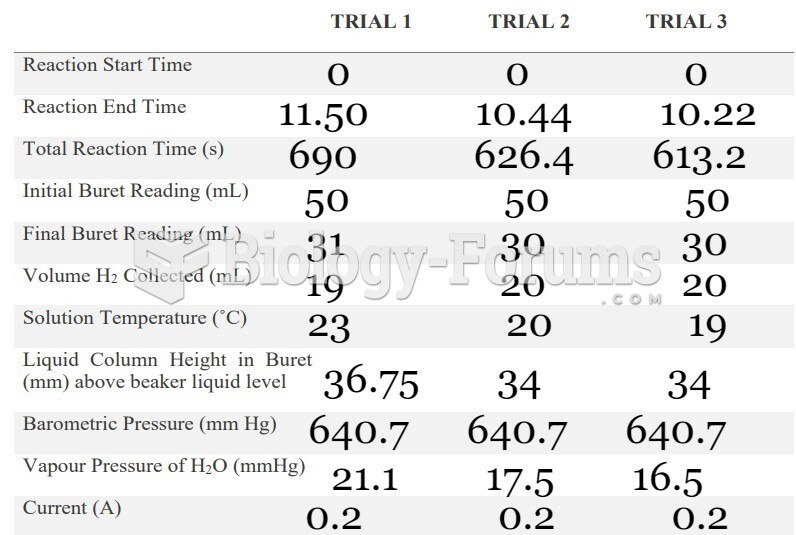 data
data