|
|
|

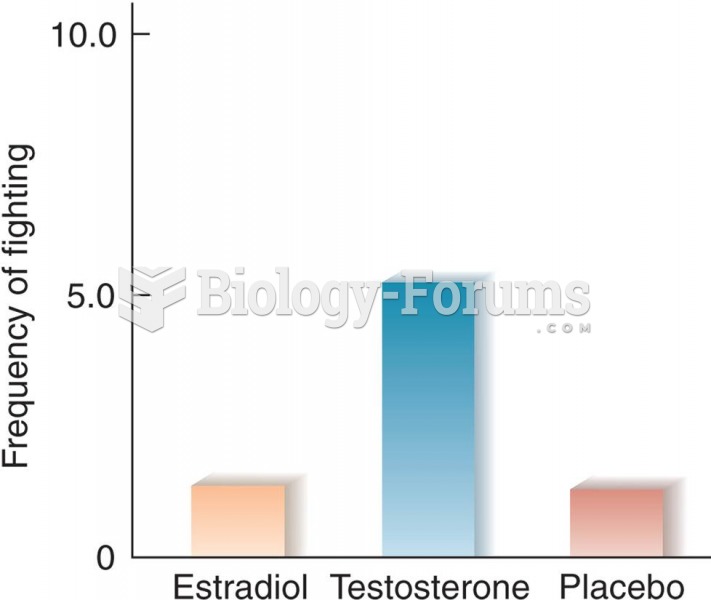 Effects of Estradiol and Testosterone on Interfemale Aggression in Rats (Based on data from van de P
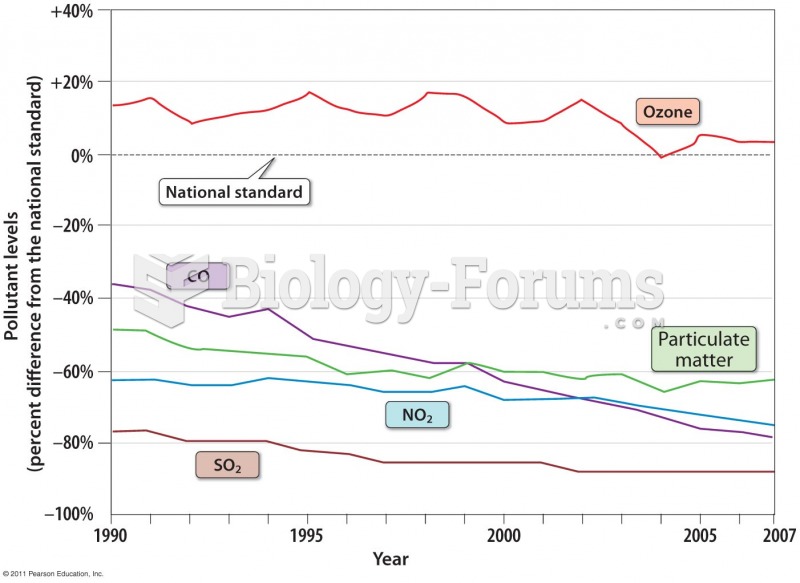 Emission Trends
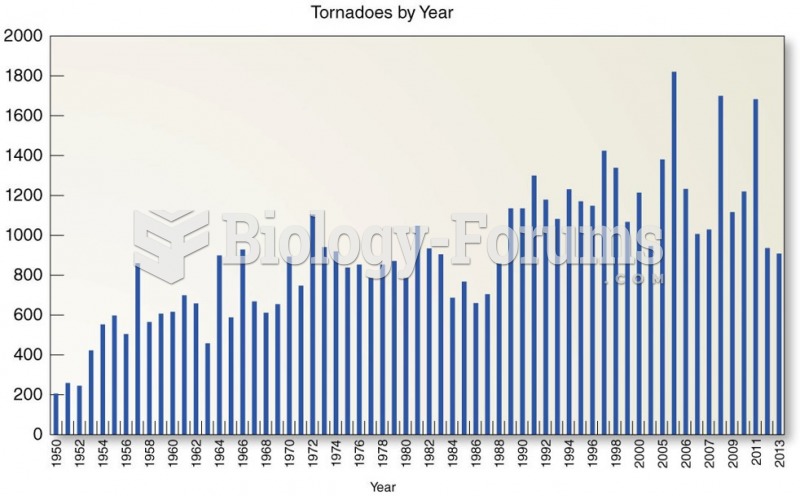 Trends in U.S. Tornado Occurrence
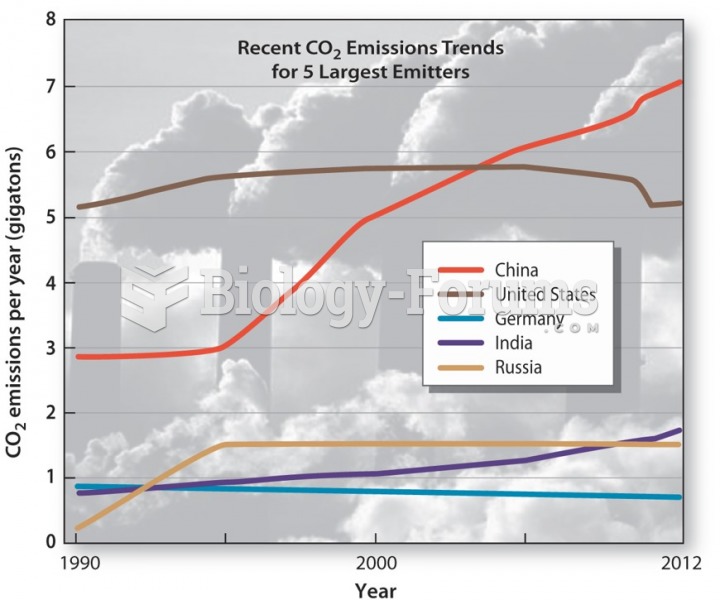 Global Warming: Trends and Tensions
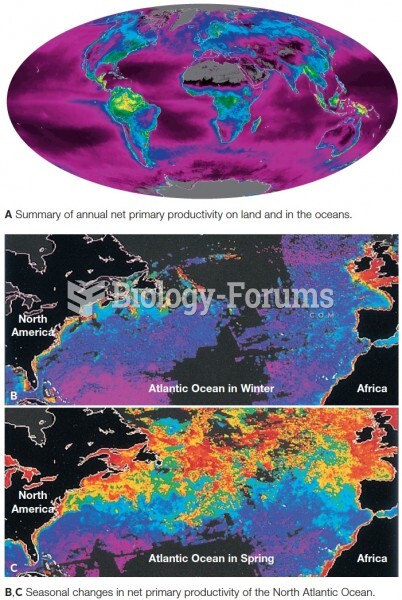 Satellite data showing net primary production. Productivity is coded as red (highest) down through o
 Chi-Square Analysis of Mendel’s Trihybrid-Cross Data