|
|
|

 Amazing NASA Pictures Collection
 Amazing NASA Pictures Collection
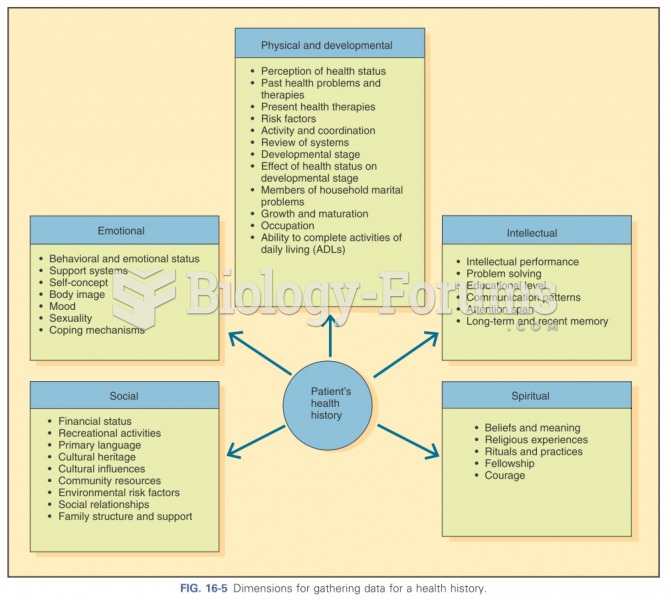 Dimensions for gathering data
 Specialized values and interests are two of the characteristics that mark subcultures. What values ...
 Basic Marketing Research: Using Microsoft Excel Data Analysis
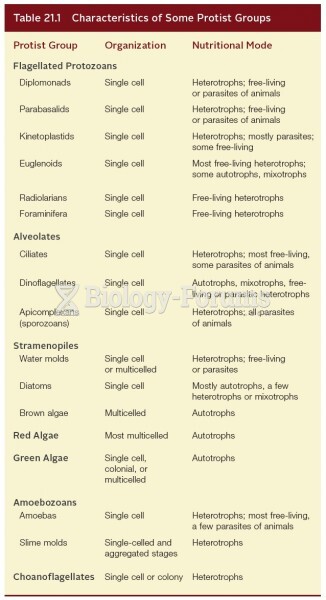 Characteristics of Some Protist Groups