This topic contains a solution. Click here to go to the answer
|
|
|

 Historian James Merrell notes several errors in Benjamin West’s famous 1771 painting, William Penn’s
 A pharmacist can explain to a patient why medication may look different and ensure the correct ...
 A simple and easy-to-use tester can be made from a lighter plug and double banana plug that fits ...
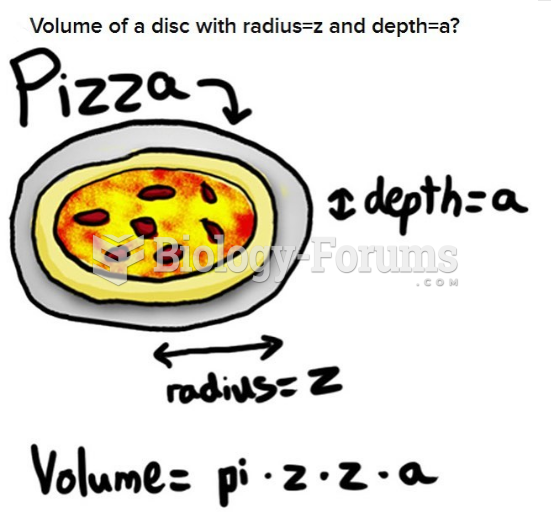 Easy way to remember to formula to calculate volume of a cylinder
 Social scientists have not done well at devising theories to explain lovely romantic moments
 Please fully explain in detail