This topic contains a solution. Click here to go to the answer
|
|
|

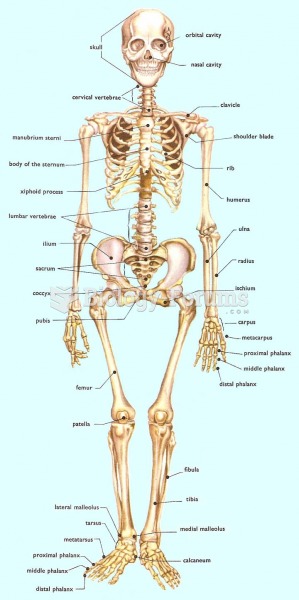 Skeleton Easy to memorise
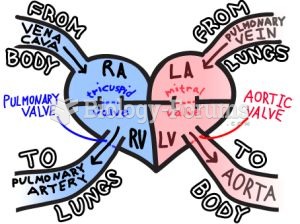 Easy way to remember blood flow through the heart cardio
 That was easy
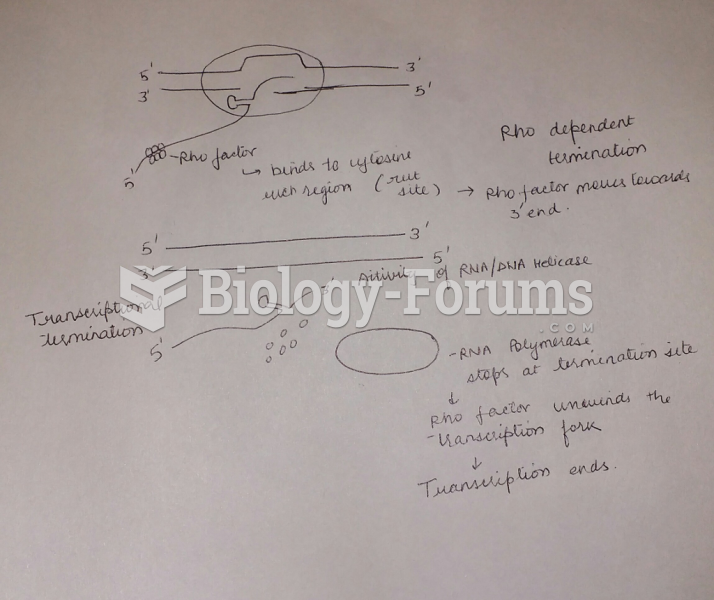 Draw and label a diagram and explain how a factor-dependent transcription (rho-dependent) terminator
 Social scientists have not done well at devising theories to explain lovely romantic moments
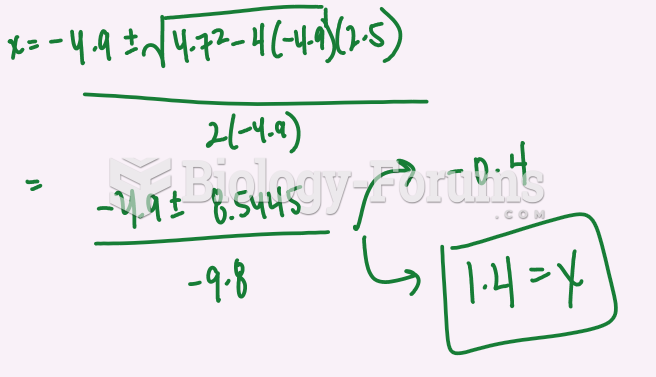 Please fully explain the answer with steps