This topic contains a solution. Click here to go to the answer
|
|
|

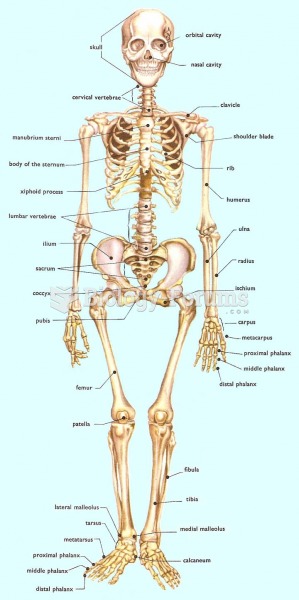 Skeleton Easy to memorise
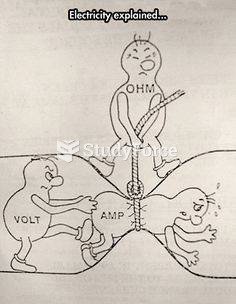 Electricity made easy
 A pharmacist can explain to a patient why medication may look different and ensure the correct ...
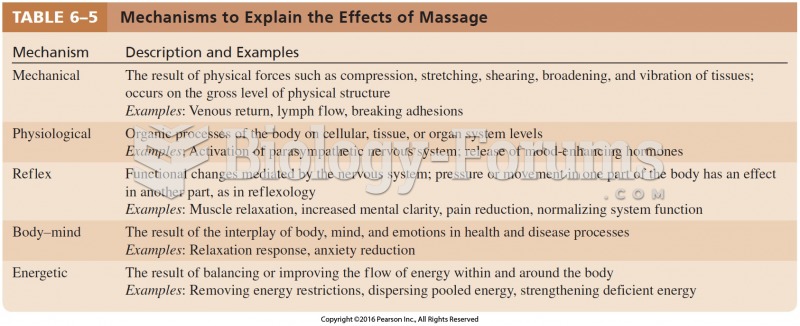 Mechanisms to Explain the Effects of Massage
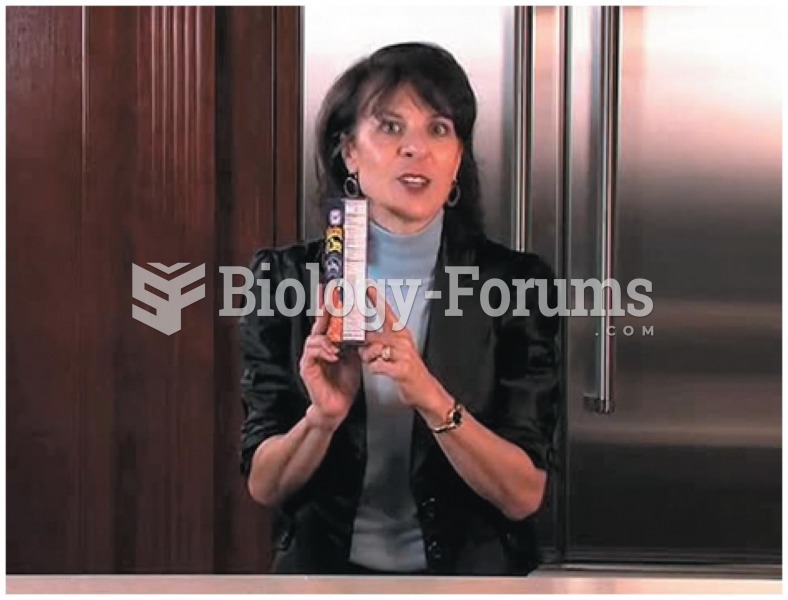 Reading a Food Label The Nutrition Facts panel is easy to read—once you know what to look for
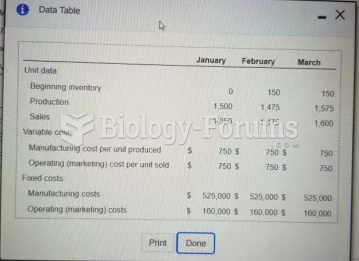 E9-23 Prepare income statements Explain the difference in operating income