This topic contains a solution. Click here to go to the answer
|
|
|

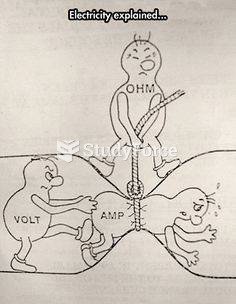 Electricity made easy
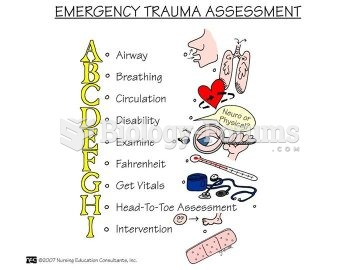 EMERGENCY TRAUMA ASSESSMENT MADE EASY
 A pharmacist can explain to a patient why medication may look different and ensure the correct ...
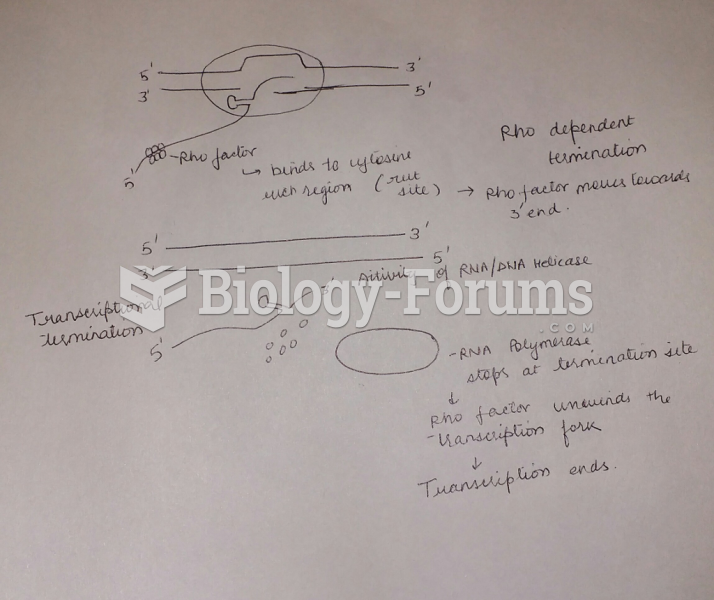 Draw and label a diagram and explain how a factor-dependent transcription (rho-dependent) terminator
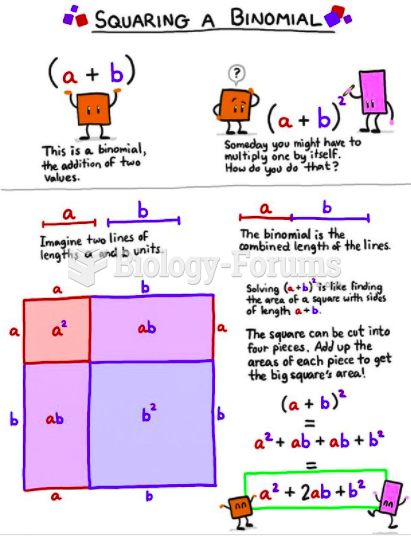 Squaring a binomial — a geometric easy way to remember
 Explain how it can be desirable from an intertemporal perspective for a country run a current ...