This topic contains a solution. Click here to go to the answer
|
|
|

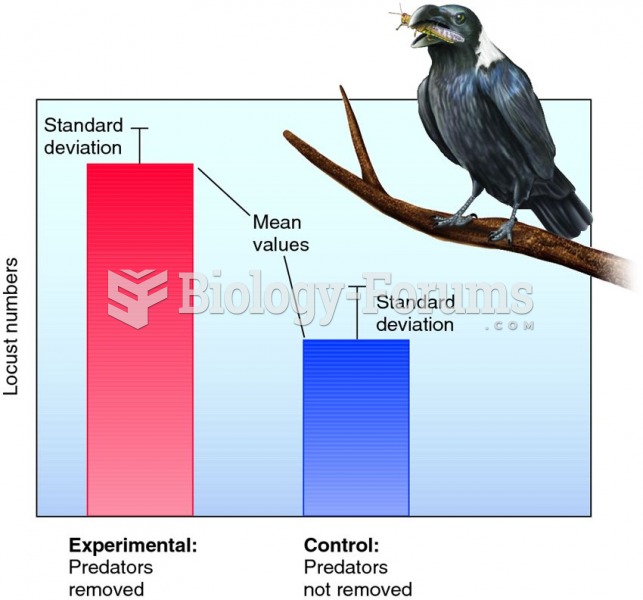 Graphic display of hypothetical results of a predator removal experiment.
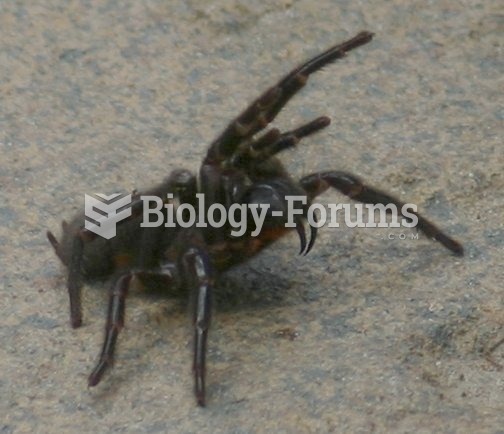 Threat display by a Sydney funnel-web spider (Atrax robustus).
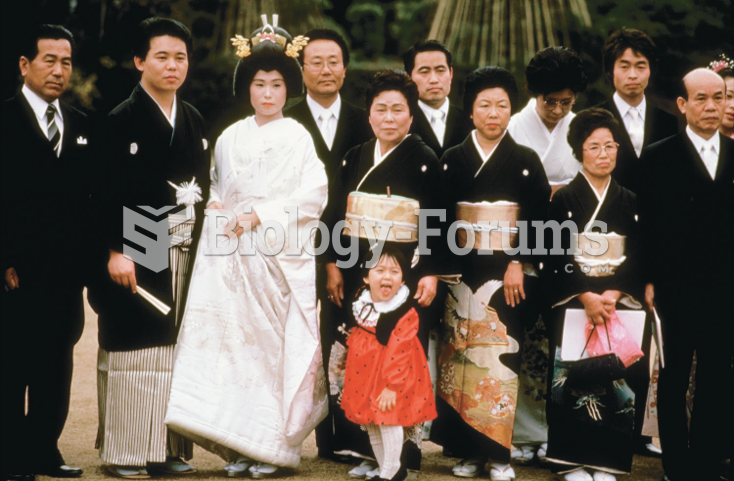
 Suzuki Harunobu, Two Courtesans, Inside and Outside the Display Window, Japanese.
 School is over—but not for this student. After the regular school day, hundreds of thousands in ...
 Display Rules
 A student creates a new blog about chemistry.