|
|
|

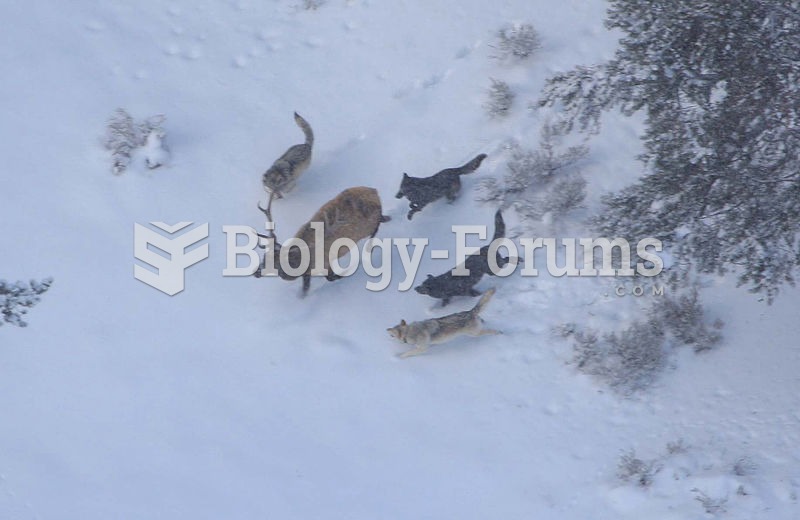 Single bull elk are vulnerable to predation by wolves.
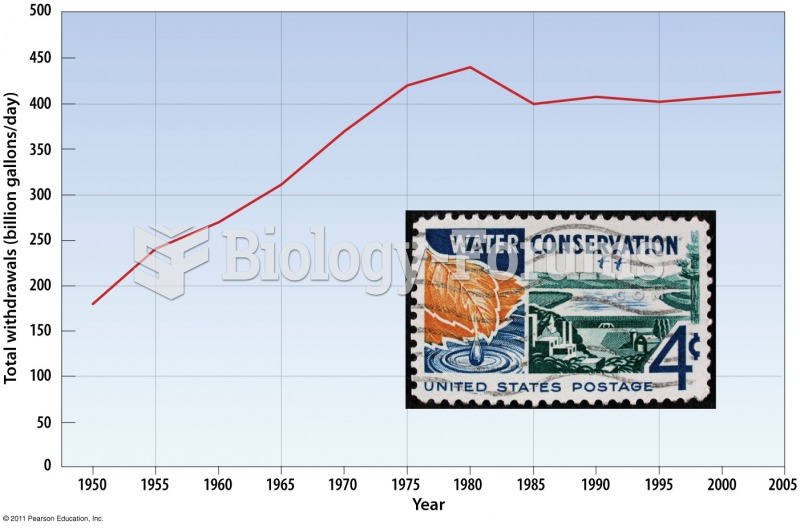 Annual Water Use in the United States
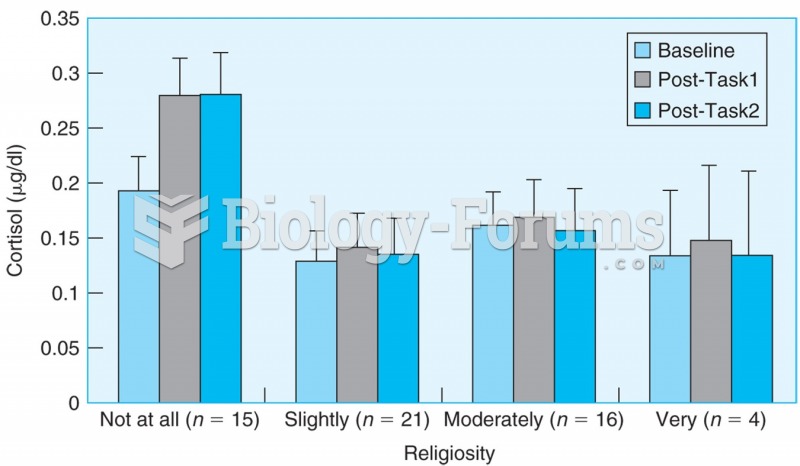 Young adults who described themselves as “not being religious at all” had greater stress ...
 Continental United States Hurricane Strikes from 1950-2011
 United States Health Care System: Combining Business, Health, and Delivery
 calculus homework graph help please