|
|
|

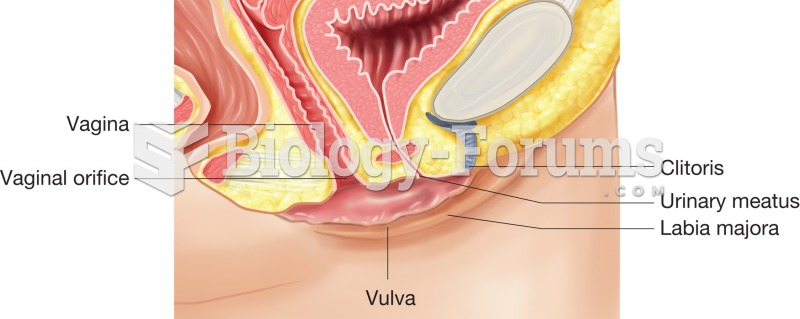 The vulva, sagittal section illustrating how the labia majora and labia minora cover and protect the
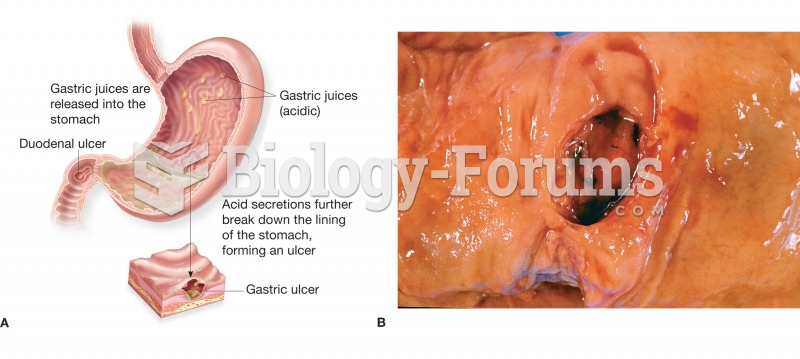 (A) Figure illustrating the location and appearance of a peptic ulcer in both the stomach and the du
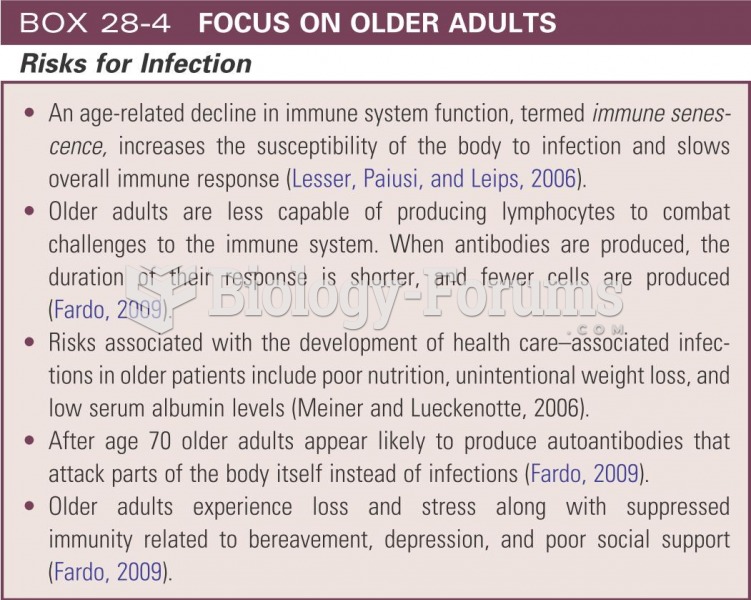 Focus on older adults - risk for infection
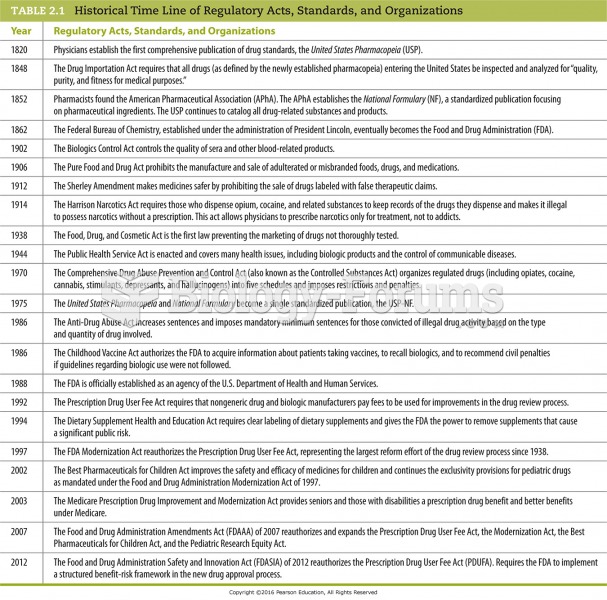 Historical Time Line of Regulatory Acts, Standards, and Organizations
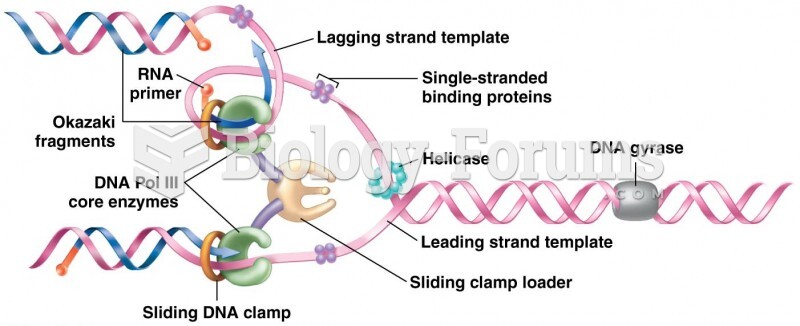 Summary of DNA synthesis at a single replication fork