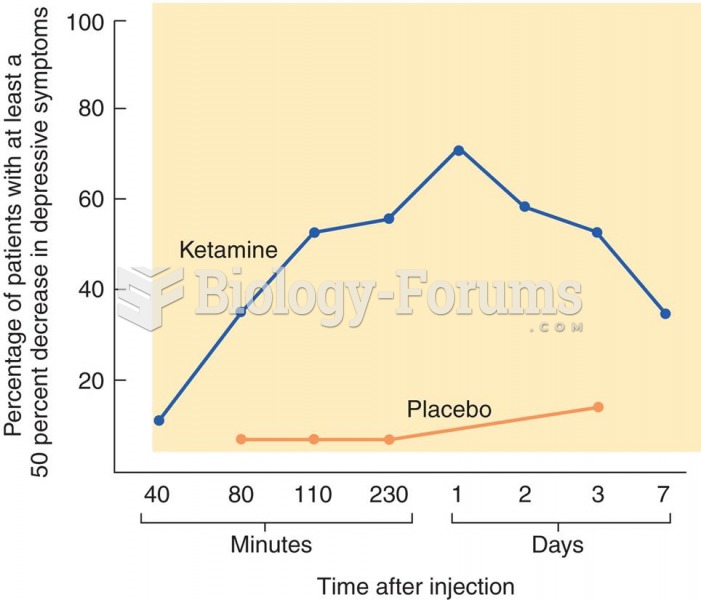
Author Question: The historical graph illustrating the percentage of single adults in the United States most closely ... (Read 43 times)

Tazate

  • Hero Member
  • *****
  • Posts: 532
The historical graph illustrating the percentage of single adults in the United States most closely parallels the graph of _______________ for the same period of time.
 
  a. the marriage rate
  b. college graduation rates
  c. the divorce rate
  d. the fertility rate

Question 2

The states with the greatest percentages of divorced residents tend to be located in the
 
  a. West.
  b. East.
  c. Central Plains.
  d. South.


mtmmmmmk

  • Sr. Member
  • ****
  • Posts: 335
Answer to Question 1

B

Answer to Question 2

A


Related Topics

Need homework help now?

Ask unlimited questions for free

Ask a Question
 

Did you know?

The U.S. Pharmacopeia Medication Errors Reporting Program states that approximately 50% of all medication errors involve insulin.

Did you know?

Fewer than 10% of babies are born on their exact due dates, 50% are born within 1 week of the due date, and 90% are born within 2 weeks of the date.

Did you know?

After a vasectomy, it takes about 12 ejaculations to clear out sperm that were already beyond the blocked area.

Did you know?

People who have myopia, or nearsightedness, are not able to see objects at a distance but only up close. It occurs when the cornea is either curved too steeply, the eye is too long, or both. This condition is progressive and worsens with time. More than 100 million people in the United States are nearsighted, but only 20% of those are born with the condition. Diet, eye exercise, drug therapy, and corrective lenses can all help manage nearsightedness.

Did you know?

In ancient Rome, many of the richer people in the population had lead-induced gout. The reason for this is unclear. Lead poisoning has also been linked to madness.

For a complete list of videos, visit our video library