|
|
|

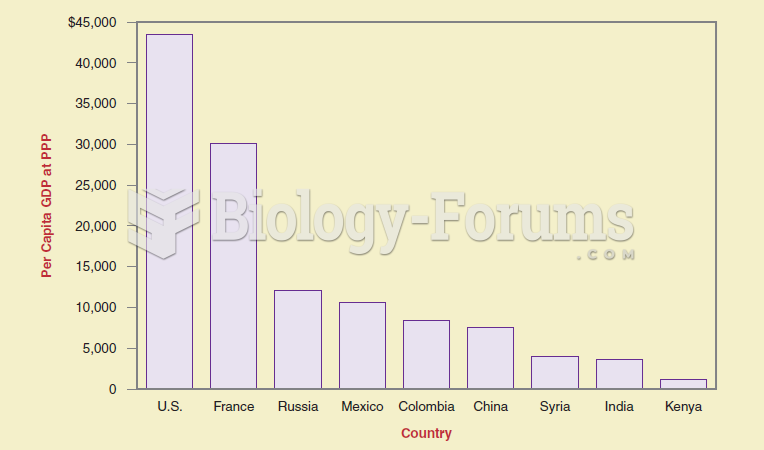 If you want to show differences between items at the same time, a bar graph is more effective than a
 Execution in the United States
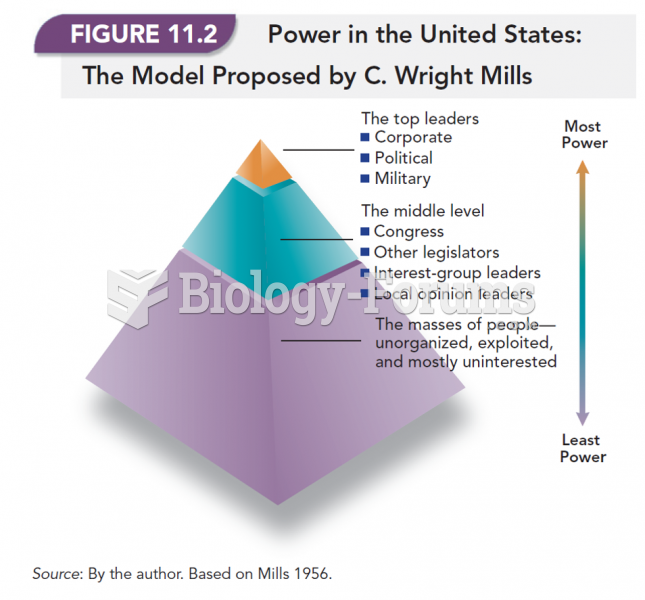 Power in the United States: The Model Proposed by C. Wright Mills
 Complementary and Alternative Therapy Use Among Adults and Children
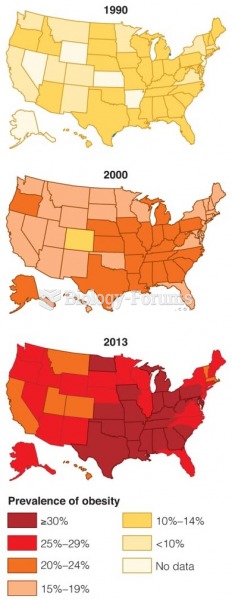 Obesity Trends among U.S. Adults Over the last two decades
 Single nucleotide polymorphisms (SNPs) are organized into blocks that are inherited together. These