|
|
|

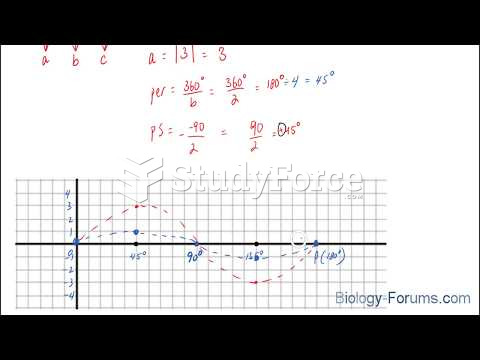 How to plot a sine function containing an amplitude and phase shift (Question 1 of 3)
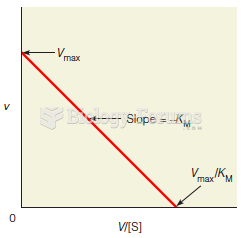 An Eadie–Hofstee plot
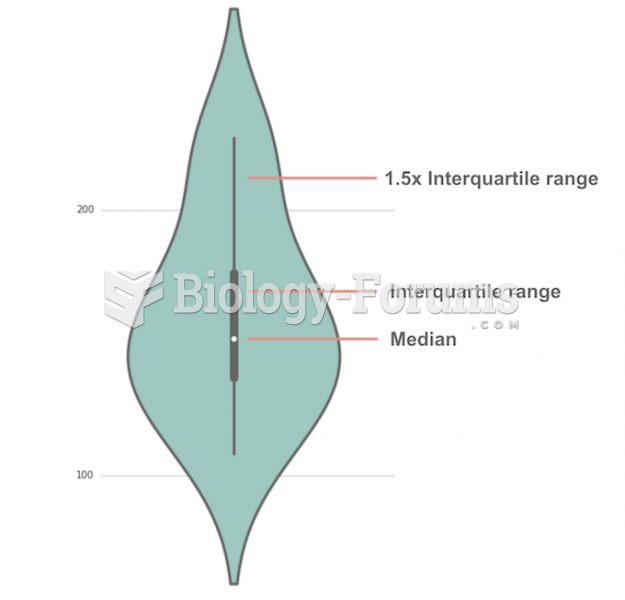 Violin Plot
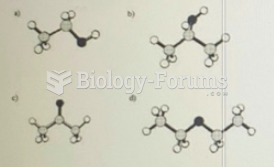 Ethanol has the molecular formula C2H6O. Which ball and stick model shown above represents ...
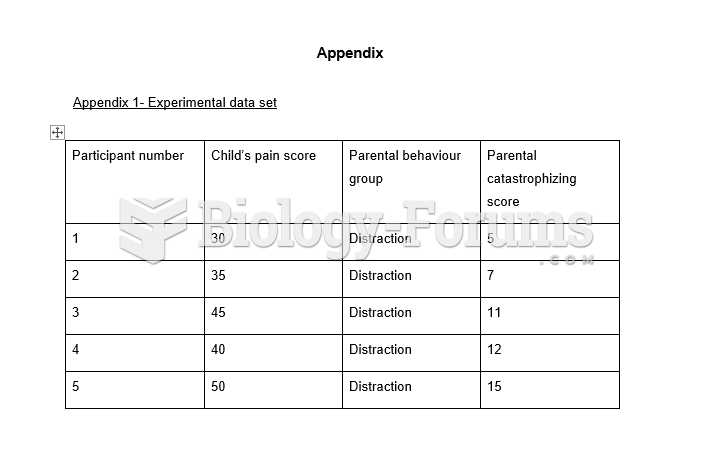 Table - Correlation Analysis
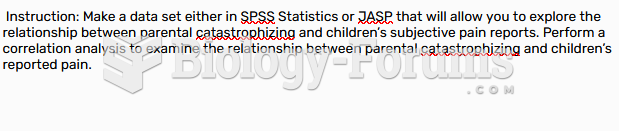 Table - Correlation Analysis