|
|
|

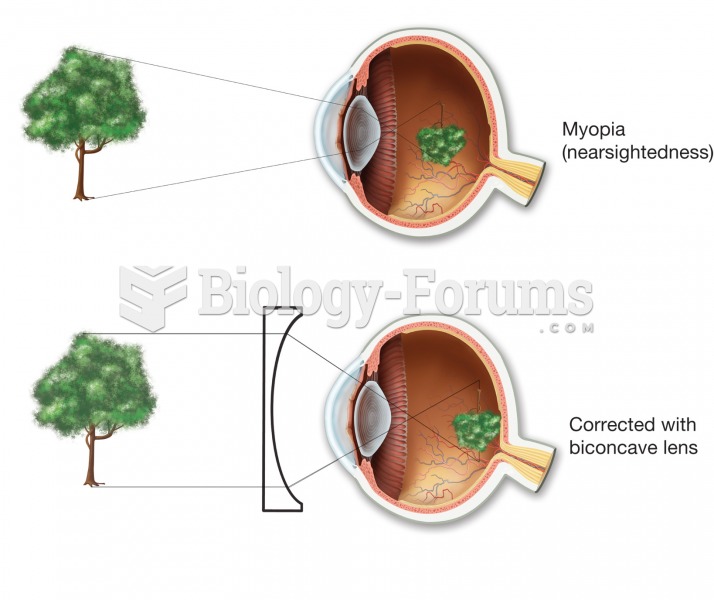 Myopia (nearsightedness). In the uncorrected top figure, the image comes into focus in front of the
 Log graph paper
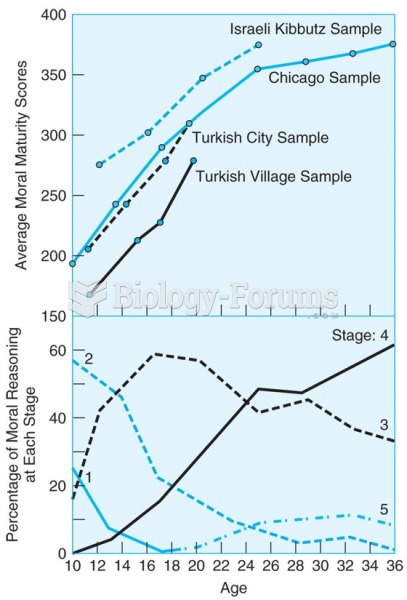 The upper panel shows that scores of four diverse samples of boys on a moral reasoning test show a ...
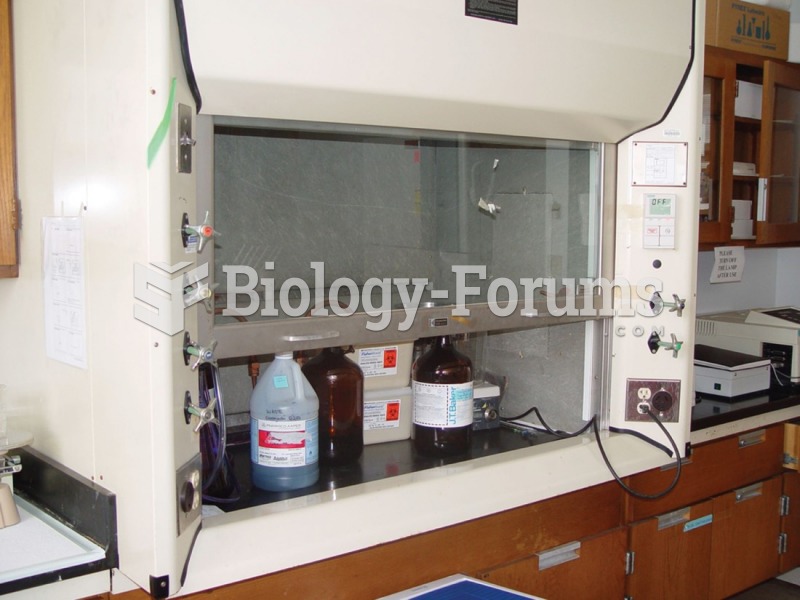 Typical laboratory chemical hood.
 calculus homework graph help please
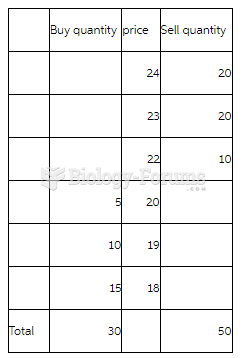 Markets and Institutions Market Story Problem