|
|
|

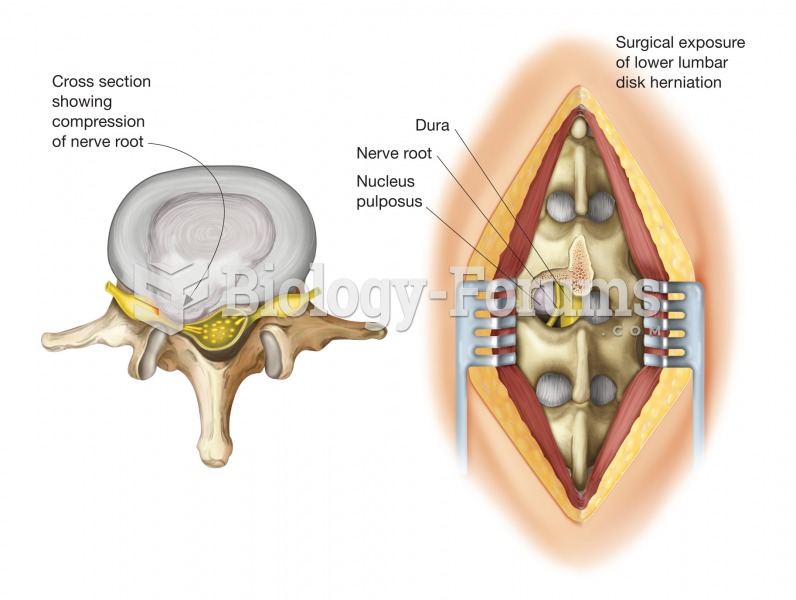 Herniated disk. A herniated disk is a protrusion of the disk’s gelatinous center, called the nucleus
 Abdominal thrusts are delivered with a firm thrust into the patient’s abdomen with an upward ...
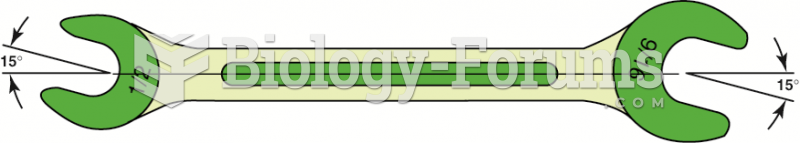 A typical open-end wrench. Note the size difference on each end and that the head is angled 15 ...
 Typical sandwich bar
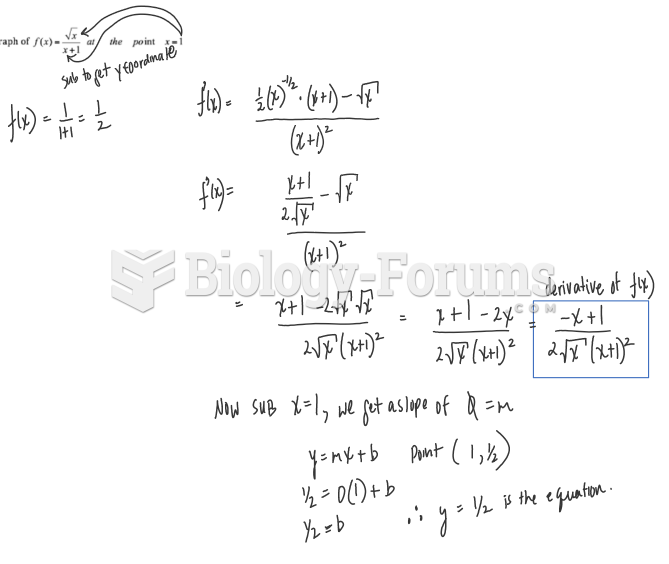 Find an equation of the tangent line to the graph of f(x) = sqrt(x) / (x+1) at the point x=1
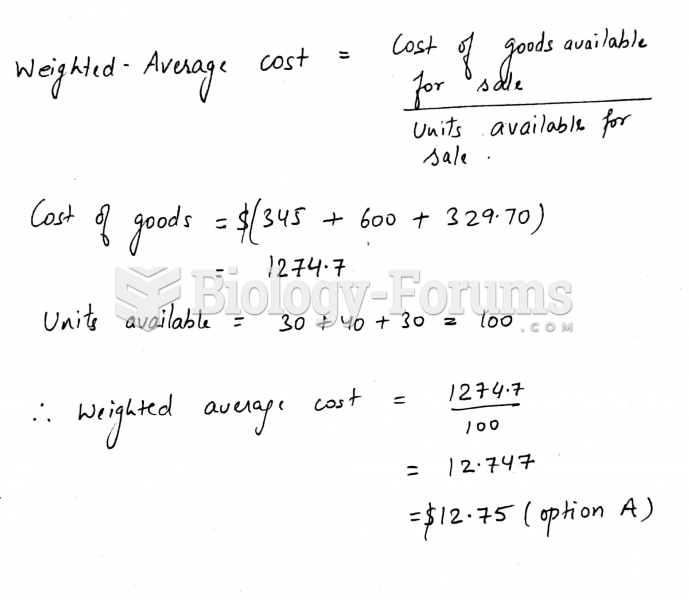 Calculate the weighted-average cost of the following inventory purchases:DateQuantity ...