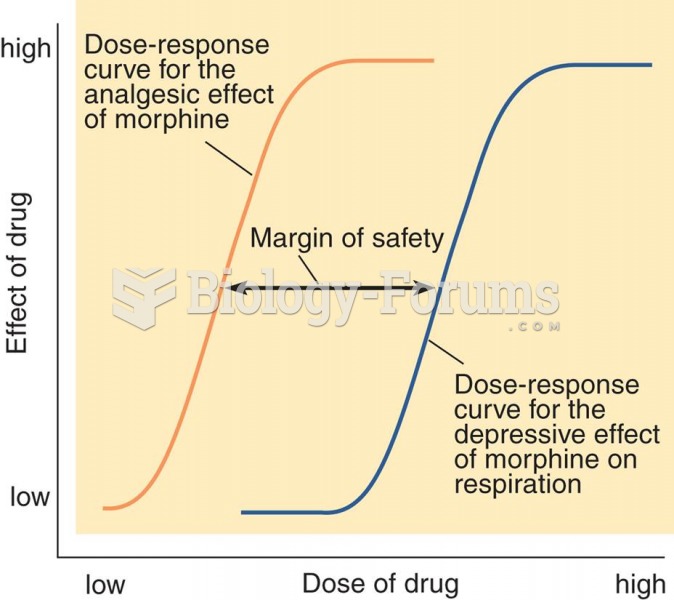
Author Question: The above figure shows the cost curves for a typical firm in a competitive market. From the graph, ... (Read 167 times)

folubunmi

  • Hero Member
  • *****
  • Posts: 524


The above figure shows the cost curves for a typical firm in a competitive market. From the graph, estimate the firm's profits when price equals $10 per unit.


mmpiza

  • Sr. Member
  • ****
  • Posts: 354
When price = 10, p = MC when q = 60. TR = 600. The AC is just above 8.5, say 8.6. This yields TC = 516. The firm's profit is estimated to be around $84.


Related Topics

Need homework help now?

Ask unlimited questions for free

Ask a Question

CORALGRILL2014

  • Hero Member
  • *****
  • Posts: 525


The above figure shows the cost curves for a typical firm in a competitive market. If there are 200 identical firms, estimate the market quantity supplied when p = 4, 8, and 10.


meganlapinski

  • Sr. Member
  • ****
  • Posts: 333
When p = 4, p < AVC so no firms will produce. At p = 8, each firm produces 50 units at a loss. At , each firm produces 60 units. The market quantity supplied at each price is:


Did you know?

The modern decimal position system was the invention of the Hindus (around 800 AD), involving the placing of numerals to indicate their value (units, tens, hundreds, and so on).

Did you know?

Parkinson's disease is both chronic and progressive. This means that it persists over a long period of time and that its symptoms grow worse over time.

Did you know?

Human kidneys will clean about 1 million gallons of blood in an average lifetime.

Did you know?

Acetaminophen (Tylenol) in overdose can seriously damage the liver. It should never be taken by people who use alcohol heavily; it can result in severe liver damage and even a condition requiring a liver transplant.

Did you know?

Many of the drugs used by neuroscientists are derived from toxic plants and venomous animals (such as snakes, spiders, snails, and puffer fish).

For a complete list of videos, visit our video library