|
|
|

 A Typical Floodplain
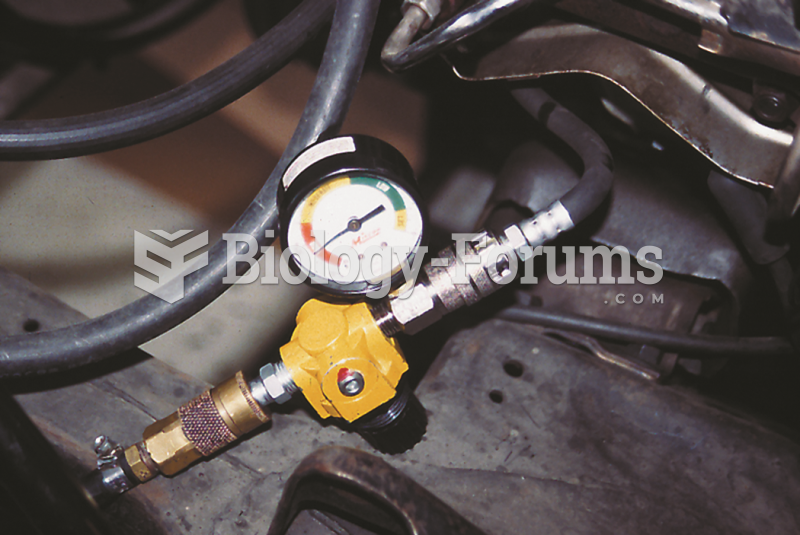 A typical handheld cylinder leakage tester.
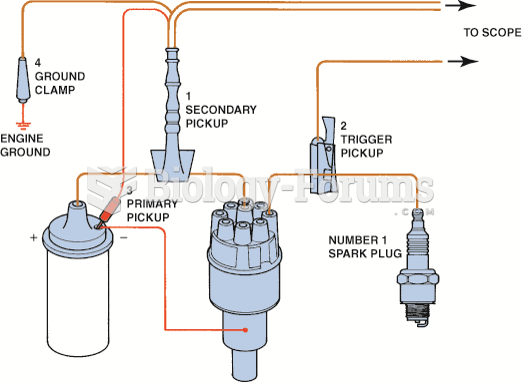 Typical engine analyzer hookup that includes a scope display. (1) Coil wire on top of the ...
 Perfect logistic curves
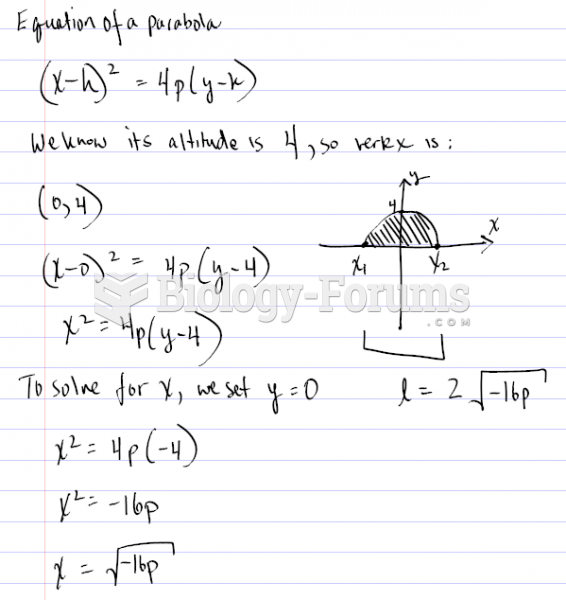 Finding the graph of a Parabola using certain values
 An inventory record sheet shows a balance on hand of 972. During the month units sold were 111, ...